VisualizationのTwitterイラスト検索結果。 850 件中 40ページ目


📢 There's still time to submit your SCIENCE Visualizations to the 2018 @NSF #VIZZIES Visualization Challenge! Submit your work by 4/15. https://t.co/0fPJaZWkgb #ArtScience #BioArt


More visualization of the world Hidden Legend Games wants to create.
https://t.co/xMdQBQkn2i


📢 CALL for SCIENCE Visualizations for the 2018 @NSF #VIZZIES Visualization Challenge! Submit your photographs, gifs, videos, illustrations, posters/graphics and interactives by 4/15. https://t.co/0fPJaZWkgb @PopSci #ArtScience #BioArt


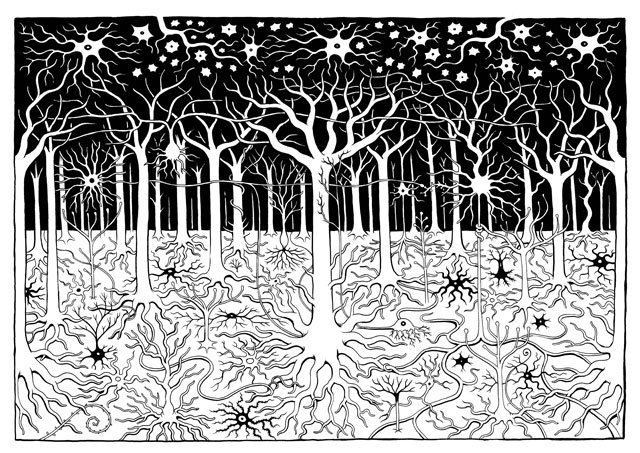
Myelination will be on display as part of Making Life Visible: Art, Biology, and Visualization ; from February 2 - June 10 at Grinnell College in Iowa!
https://t.co/crFCL99QvI
#grinnellcollege #sciart #brain #neuroscience


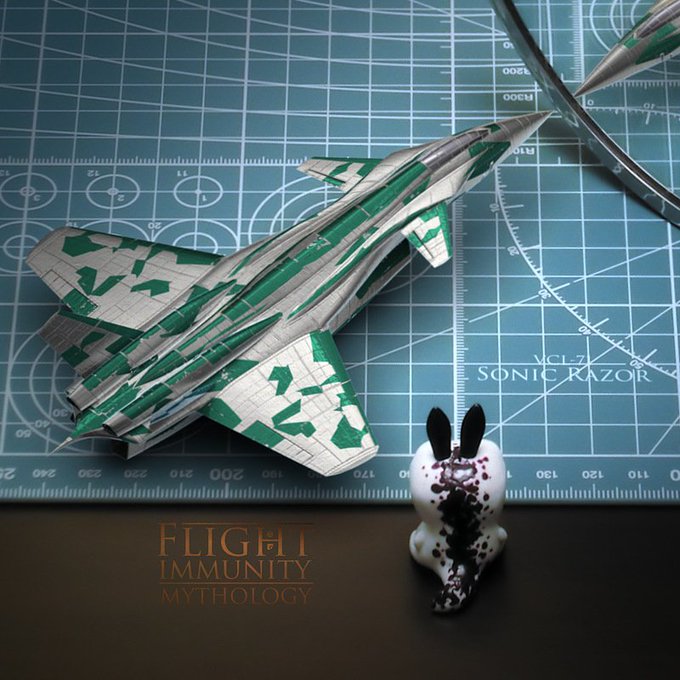
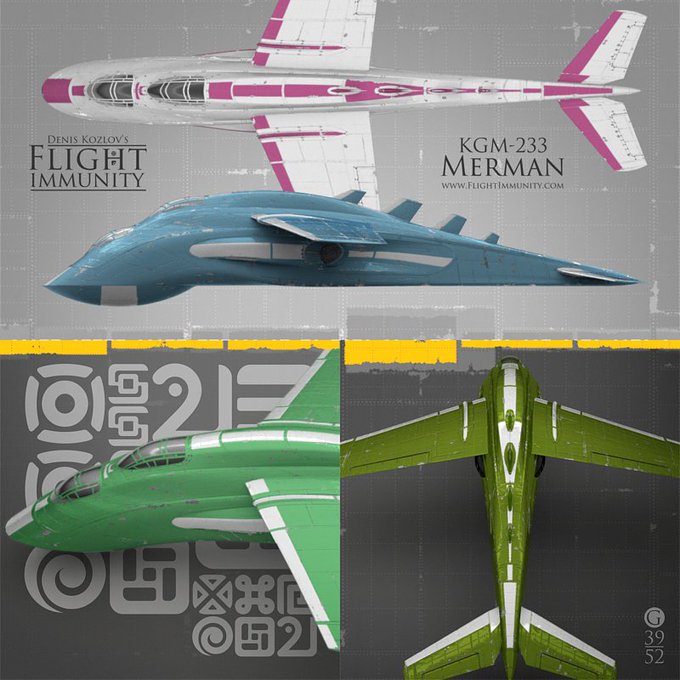
Our best renders from February!
#conceptart #scifi #aviation #plane #vfx #cgi #visualization #3dart #avgeek #plasticmodel #scalemodel #プラモデル #スケールモデル #コンセプトアート

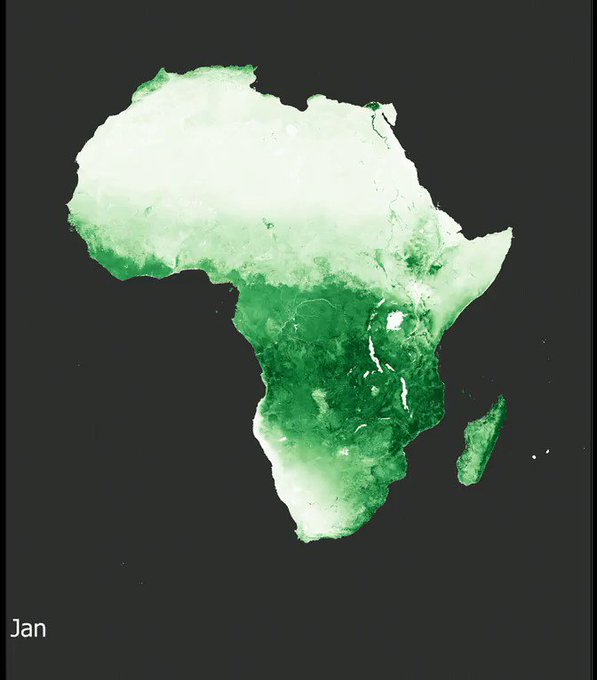
An impressive visualization of the vegetation intensity variations in Africa during a solar year https://t.co/ehTi7zft3J [more info about the Normalized Difference Vegetation Index (NDVI) https://t.co/mtgmvXZS8m] [data source: https://t.co/RyV1eBI9WM]


Your Energetic Oasis and Gateway to the Other Side - Visualization can be such a powerful and useful tool in your life and you will find it can help you in a variety of ways. Today I have an exercise for ... https://t.co/xKhmxTihW7

A data visualization suitable for #ValentinesDay. 24 hour traffic isochrone heartbeat from the U.S. Who can name all the cities?


wow the visualizations continue to increase!
thanks for the support! ☺️
#LINEWEBTOON #webtoon #CicatricesDOE #webcomic #comic

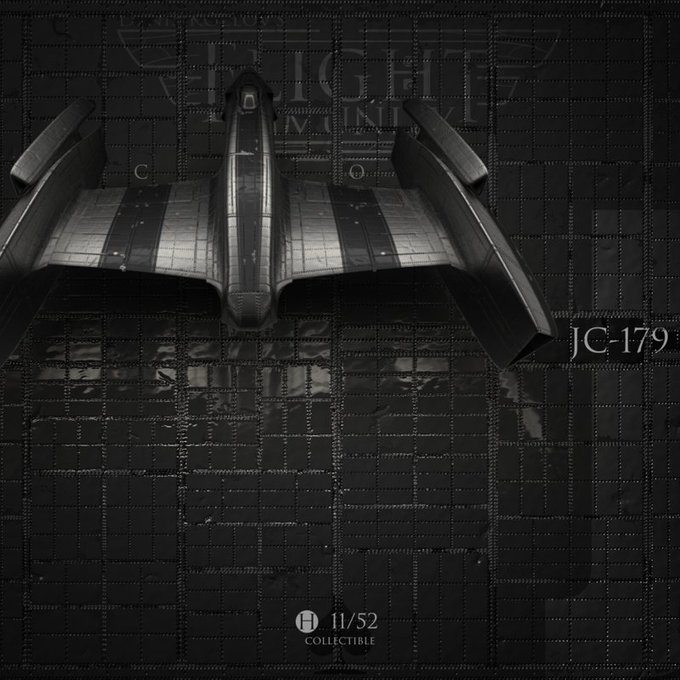
Our best renders from January!
#conceptart #scifi #aircraft #vfx #cgi #visualization #spacecraft #art #design #houdini #procedural #3dart #avgeek #motorsport #3D #archillect #コンセプトアート #飛行機 #メカ


I'm calling it on this one, she's done! This is the visualization of Mialee Yaeldrin, DnD character commission for @BethofJoy. This one is all done in vector and I love how she turned out! And I'll have another one of these to show you in a week or so =)


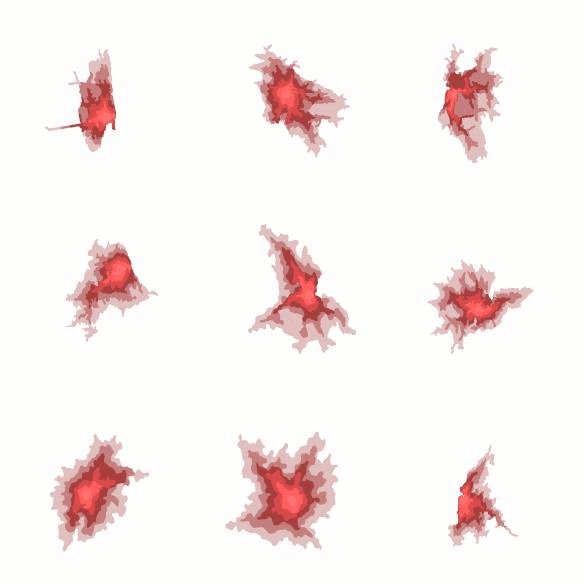
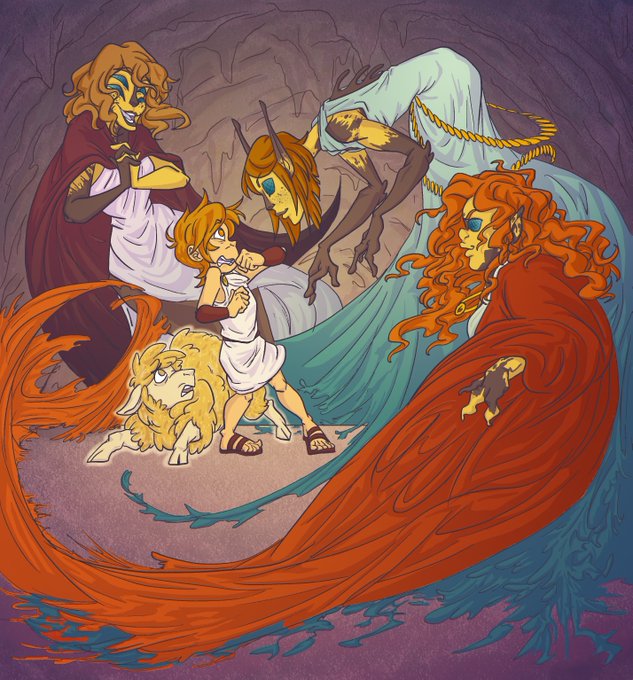
The full illustration I produced for Gummy Guts 2, "400 metres"
Depicting a psychedelic visualization of metabolic acidosis & the visceral sensation of the pain, exhaustion of the muscles during competitive sprinting. Chose greyhounds cus duhh lol
+Sketch, colour tests and lines


Genomic Interactive Visualization Engine https://t.co/lD0ujnswJ1 a HTML5 library that lets you embed genomic visualization panels like you work with standard HTML elements, to build a customized genome browser to visualize data from public deposits (such as ENCODE)


Hey, I'm Phil and a 3D artist working in games, visualizations and illustrations! I love Zelda, #gamedev and my cats! #artistsontwitter


Greek. Zbrush . . #amadmonkstyle #zbrush #3d #3dvisualization #3dprinting #cg #art #pixologic #palermo #ig_sicily #igers #italy #italian


Inspiration for first day of sci-fi course:Ward Shelley's amazing visualization of the complex history of #sciencefiction -thanks @kimonizer


Hope you get a little relaxation in on this Labor Day.
#iconography #design #infographics #infographic #infographicdesign #visualization


Ok, one more visualization. Distances this time. I really should get back to proper work now


#3d visualization of science-fiction and space : Interview with Christian Hecker, Please share #digitalart https://t.co/fVamGnqXIf


@Justinoaksford Student in senior year of Visualization at A&M with a huge interest towards character concept and illustration! https://t.co/xmuoqfnsKC