3/ Have less data because you're showing events from 218BC? That's OK, just smooth out the steps.
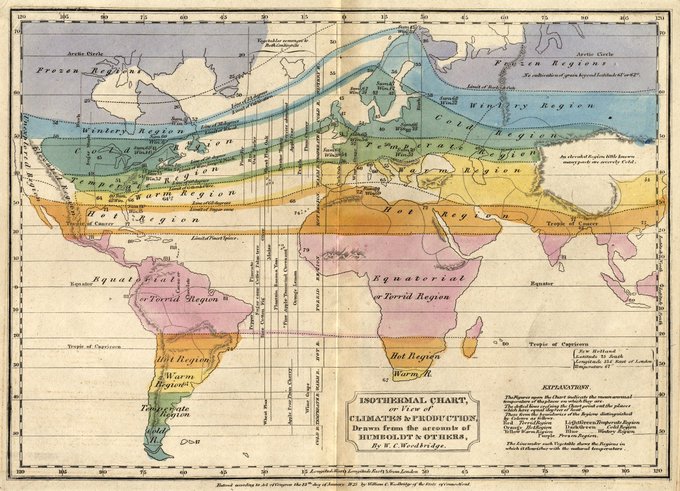
may have found patient zero for rainbow🌈 palette dataViz.
William Woodbridge, 1823. Guilty.
A couple of never-too-late additions to the #chartCaps font!
& transit map
? contour map
@AllanWalkerIT I believe at least 2 charts are required before you can call on Rainbow Dash #dashboardJokes
A hand drawn effect can ⤴️ engagement with data. Sometimes the best way to get this effect is to draw data by hand.
https://t.co/8epNA3r3NW👀
.@TASCHEN @NatGeo @kaityarnall 3⃣ So delighted to encounter this thematic ancestor to my own ENDANGERED SAFARI
🐷🐻🦁 Anthropomorphism yes please!
Stereotypes of animals, one of my favorite wiki articles:
https://t.co/ooeciiTl6y


