
Nina Lindellさんのイラストまとめ
@ninatsutsFollow @ninatsutsさんをフォローする
#cities #placemaking #maps #dataviz #spatial #rstats. Here: a collection of learnings, experiments, and own thoughts.
public.tableau.com/profile/nina.l…フォロー数:793 フォロワー数:601
1 件中 1〜1件を表示

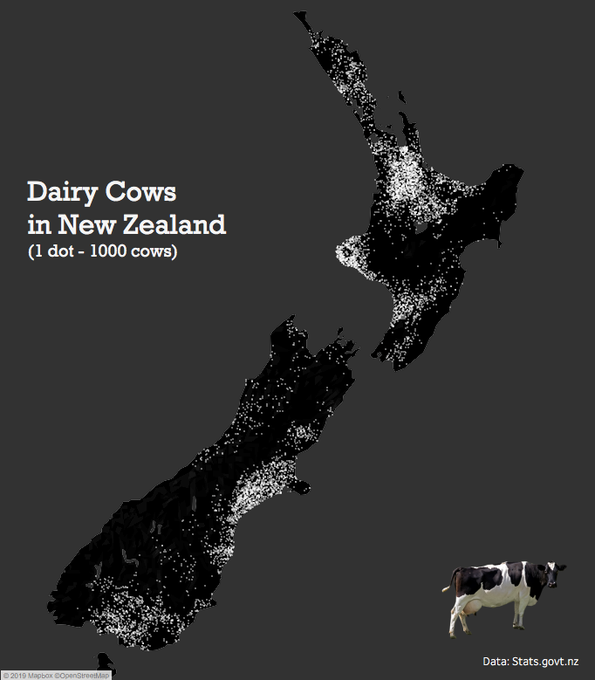
#30DayMapChallenge Day10: black & white. A simple dot density map (first one for me) of dairy cows in NZ (which are sometimes b&w:). Made with st_sample() from {sf} package #rstats, visualized in #Tableau.
7
48