
Nicholas Rougeuxさんのイラストまとめ
@rougeuxFollow @rougeuxさんをフォローする
フォロー数:835 フォロワー数:4763


@SonjaKuijpers @mikebrondbjerg @wblut @bit101 I think the ideal solution would be one that can calculate the area based on the control points, accommodate curves, and could solve for any one of these situations.


New project: I recreated and restored Elizabeth Twining's 1868 catalog, Illustrations of the Natural Orders of Plants, comprising 160 interactive illustrations and of course new posters: https://t.co/XOXHJqVsYp. Plus, there's an in-depth blog post made: https://t.co/fUqm4qXaLr

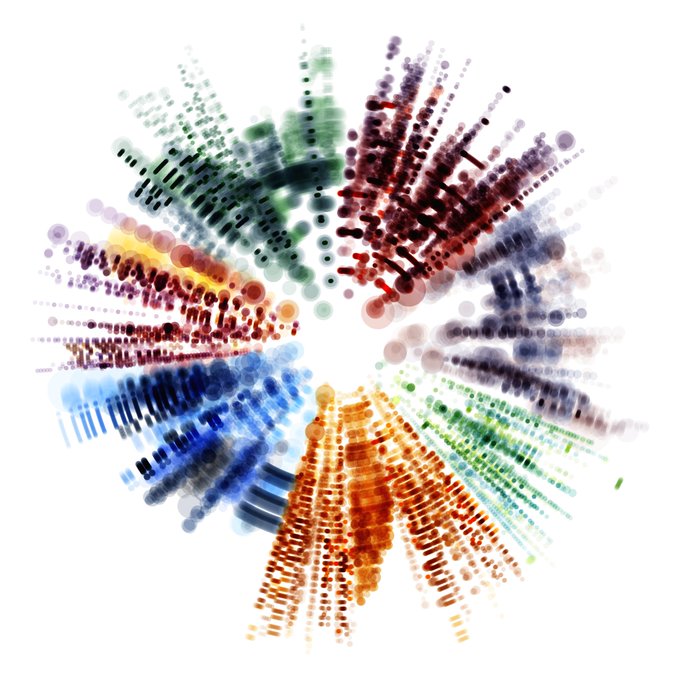
First face on half the data of a new project. Not anywhere near the final visual but the first "family photo" of the data. Nice to see the distribution so varied. This will be fun to play with.

Bonus release: All seven movements from The Planets by Gustav Holst in two new Off the Staff posters and videos in partnership with @OpenScore.
https://t.co/zX5MhUCkRn
https://t.co/SwMHhfOel6

Mars, the Bringer of War from Gustav Holst's The Planets. A new Off the Staff poster and video in partnership with @OpenScore. The first of seven movements from his amazing opus. Next one coming tomorrow.
https://t.co/vNUKkCESDM


Announcing Æsop Blooms: Reimagining classic fables as colorful bouquets. https://t.co/o1q2f8b9Tz
Plus, a new post about how they were made including a small bonus at the end: https://t.co/jiCYi4lcUl


I'm always drawn back to transit data. Here's a mesh of Every "L" station in Chicago connected by the color of their lines. Messy but fun.

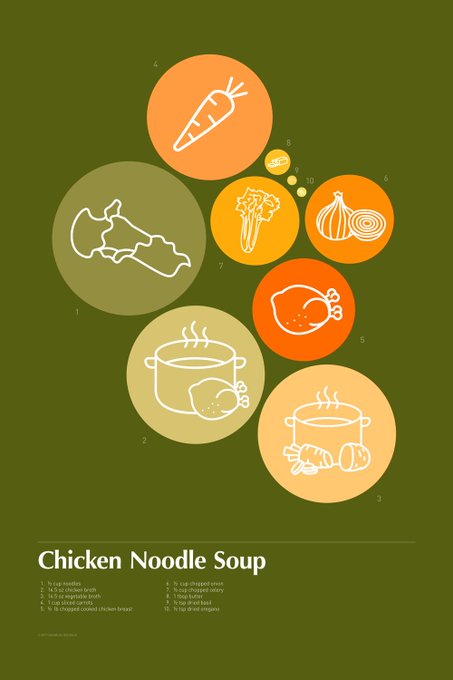
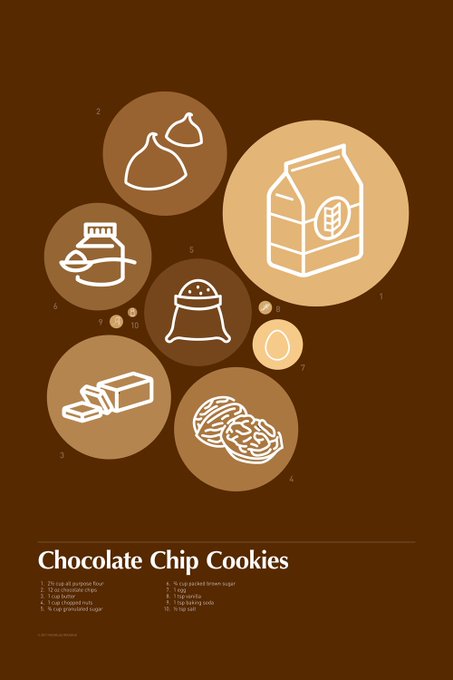
Fun experiment visualizing ingredients in comfort food proportional to each recipe. Anyone interested in more?