156 件中 151〜156件を表示
Map shows global temperature anomalies for 2016, relative to 1981-2010 average.
0
1
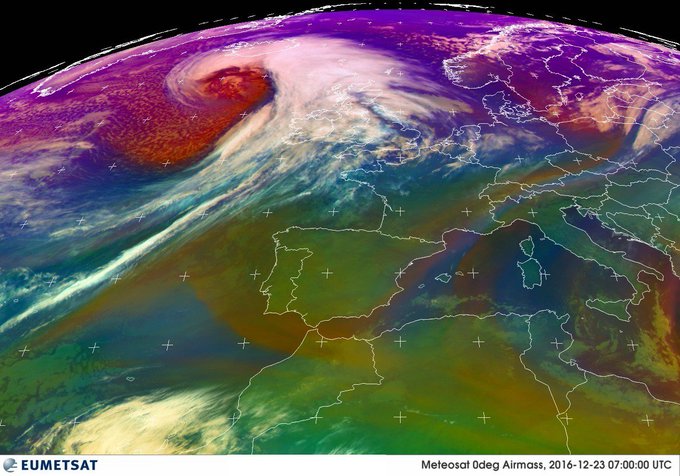
satellite imagery shows the cloud structure of #stormBarbara - as she heads between Scotland and Iceland today
3
1
Map shows global temperature anomalies for November 2016 (relative to 1981-2010 average)
3
4
This afternoon's NASA satellite imagery shows snow covered ground - coloured red to distinguish from cloud !
2
3
The polar vortex has been weak for weeks! And the forecast shows little change.
4
15


