//=time() ?>
In today's episode of every chart is just another chart, violin plots are just aloof streamgraphs. #d3js
No Man's SVG - fractal noise elevation map bl.ock with #SVG for eventual use with #d3js https://t.co/5Q8e0q4kOy
Visualizing K-means #d3js #MachineLearning
https://t.co/E6CJI97X1Q
https://t.co/UOkkrNsUyZ
App du-scales : utilisation
#SVG #D3js #JS #JSON #HTML5 #CSS3 #dualo #du-touch #musicians
https://t.co/6NxVvnpUjX
du-scales app, new layout ! <3
https://t.co/6NxVvnpUjX
#SVG #D3js #JS #JSON #HTML5 #CSS3 #dualo #du-touch #musicians
I made a brushable version of @DataToViz's radial weather chart. #d3js
http://t.co/DaARGVXJLk
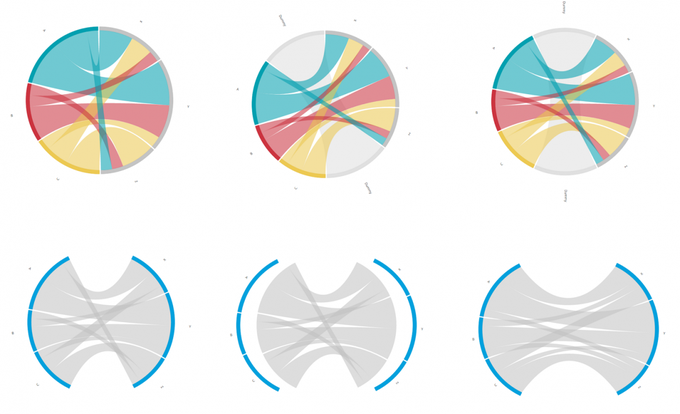
Oh boy, @NadiehBremer hacks #D3js source code & makes circular Sankey http://t.co/uJJ0ZpRW6u Another great tutorial!
Thanks to @alignedleft, made my first #d3js map of my US travel. Aaaand a bl.ock. Fancy. http://t.co/BqZoLwfO34