d3jsのTwitterイラスト検索結果。 10 件


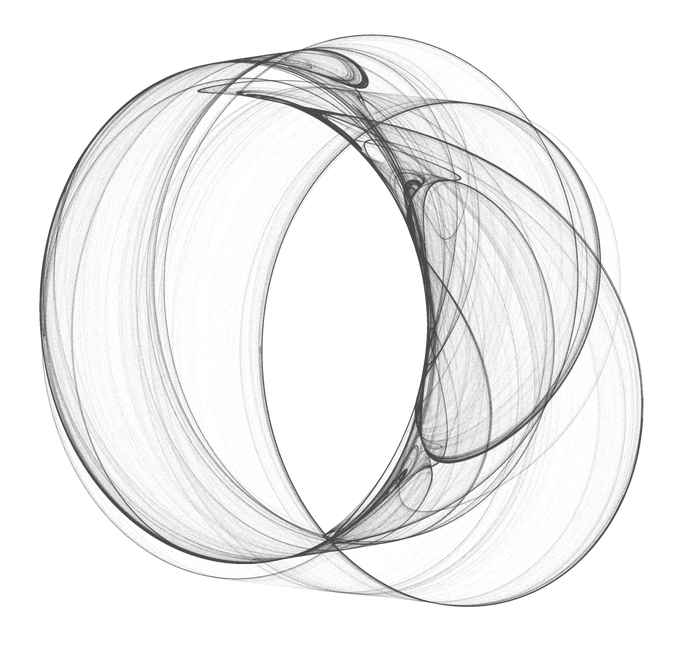
Trying to go for a flickering light/orb situation and experimenting w/ #d3js force and it's a bit more manic? than I was hoping for 😅 I can't seem to slow it down even after fiddling w/ alpha, alphaDecay, and velocityDecay 🤷♀️
I think I'm headed in the right direction tho ✨


Meet #DataVizSociety member Will Chase (@W_R_Chase), data scientist at Upenn researching epidemiology of tuberculosis in Africa, focusing on dataviz. He works mostly in #rstats & is currently learning #D3js. In his spare time he also makes generative art.
https://t.co/mJYTKJL7dv


Pursuing my exploration of #perlinNoise with #canvas #generative #d3js #canvasSketch

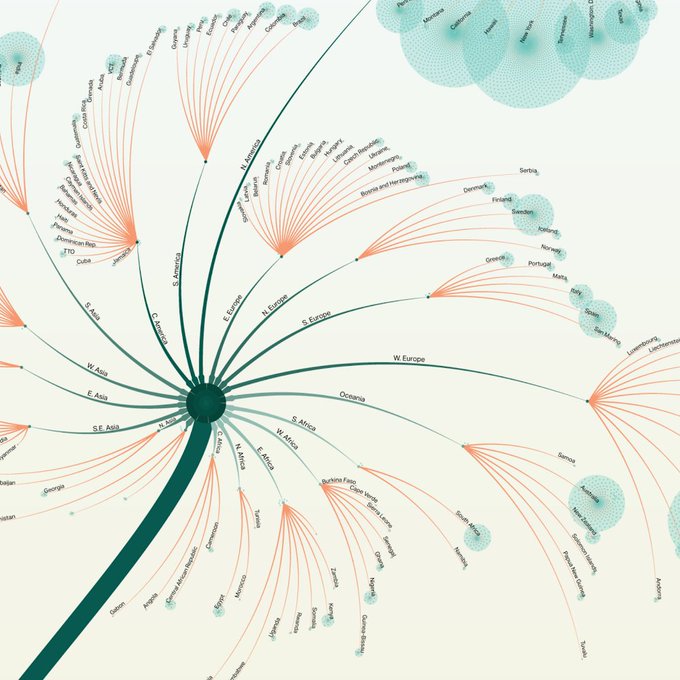
Where did the #MeToo Movement spread?
Explore the full #dataviz
https://t.co/9bAIckWDPt
#graphics #graphicdesign #metoomentum #d3js


I made a two part tutorial on how to create animated transitions between maps and diagrams with #d3js on @observablehq.
https://t.co/zSz3Evi8S2


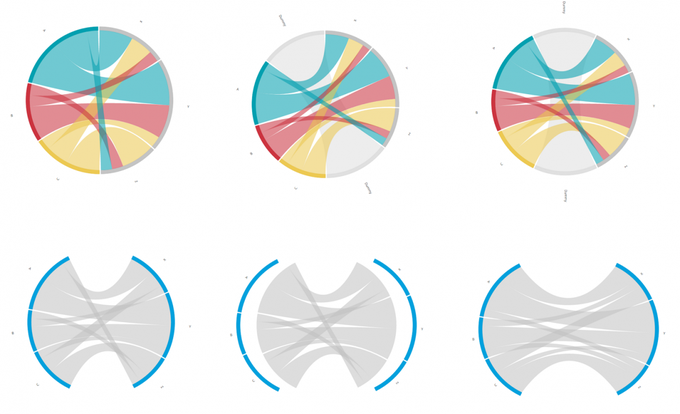
Oh boy, @NadiehBremer hacks #D3js source code & makes circular Sankey http://t.co/uJJ0ZpRW6u Another great tutorial!

