DatavizのTwitterイラスト検索結果。 351 件中 15ページ目


Travel Visa Inequality - The #dataviz explores how equal different countries are treated in terms of traveling - https://t.co/PKaW4TixWy


1 million funding for Flourish data visualization platform from @localglobevc. Can't wait to try it 😊 https://t.co/QM5GD3PWZF #dataviz


The @WIRED has brought together designers who do wonderful hand-drawn visualizations: https://t.co/PTzPrVzI0E #infoviz #dataviz #dataArt


(N) Playing around with my February #dataviz 😁 Anybody dare to take a guess what kind of data (topic) is (somewhat) guiding these lines? 😅


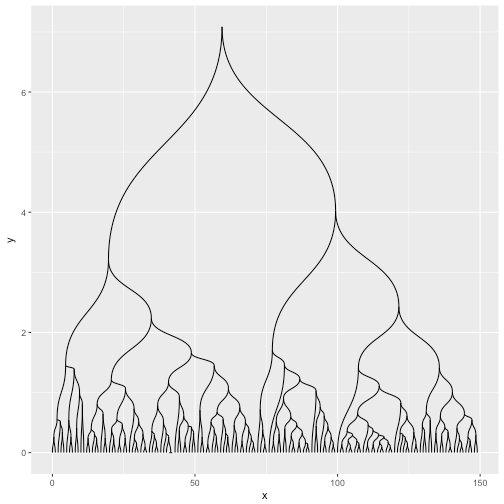


Code-through fun continues: "Introduction to ggraph: Edges" by @thomasp85 https://t.co/69VjIM5V9c #rstats #dataviz #ggraph


When Data meets Art — Series of abstract data-visualizations #generative #dataviz #IBM #throwback
https://t.co/giRNNcvCNC


Population Density in the #GGH, 2016 https://t.co/296pfdO7Z3 by @mapTOdotca using @Mapbox #toronto #topoli #dataviz #census2016 @willy_maps


⚡️ICYMI⚡️
We're wrapping up 2016 with a special awards themed ICYMI.
#dataviz #contentmarketing
👉 https://t.co/Q1imQsZ7x1


Cool bubble chart for visualising data https://t.co/AXx9GpPj5O #sketchapp #dataviz


La violence : #dataviz des transactions @Shopify en temps réel 💸 https://t.co/NAqJwU8PAY


A few images from my #kidsbook! #infographics + #illustrations https://t.co/9kSetHKpd1 #dataviz #behance 🌿


New blog post about experimental #dataviz techniques: https://t.co/aPRMA0O3z0
Image: Iris dataset MDS + color-coded original data features

Ma nouvelle bible : un générateur de #dataviz et autres experiments + ressources web 💎 https://t.co/w40ylfAUK7


Half of all cereals are discontinued after 5 years https://t.co/hMLI6hOQgk #dataviz

Cool bubble chart design in Sketch by @paulhershey https://t.co/AXx9GpPj5O #sketchapp #dataviz

Cibo e letteratura: la mia nuova #dataviz illustrata su @La_Lettura! #vivalaLettura #illustration #datajournalism


8 Best Data Visualization Blogs: Make the Internet Smart & Beautiful https://t.co/ERTHXt6Kvt via @infogram #dataviz
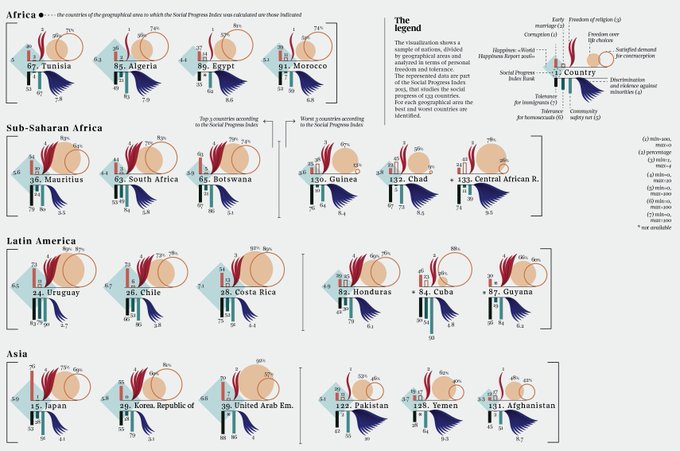
#SocialProgress – Freedom and tolerance by country. My #dataviz on #behance https://t.co/k00vTSxV9C #datajournalism