datavizのTwitterイラスト検索結果。 255 件


🗺️A Map Showing Terrain Model of Mt.Rainier 🏔️( Pierce County, Washington, U.S🇺🇸) Data source from @OpenTopography (USGS10m) #MtRainier #gischat #cartography #dataviz #QGIS #Blender3d #DataVisualization #Geospatial


New to R? Learn how to create customizable data visualizations using ggplot2 with this tutorial. Increase visibility and improve repeatability with a range of visualization options that go beyond point-and-click software
#dataviz #Rstats
https://t.co/FZUR7IXSK0

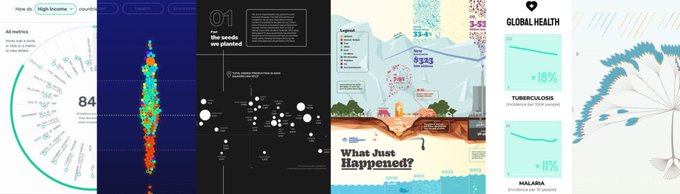
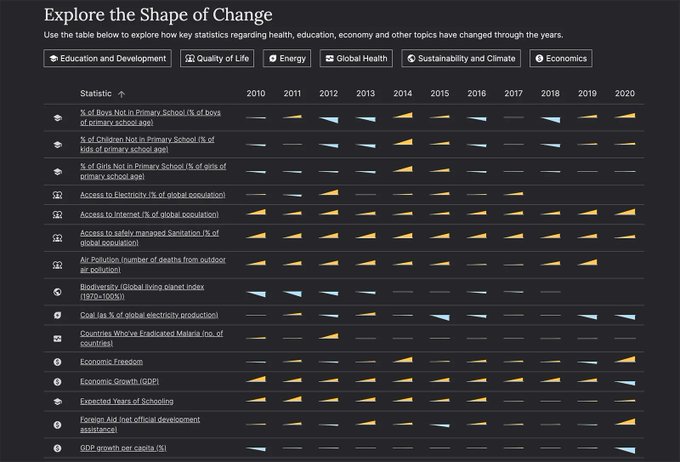
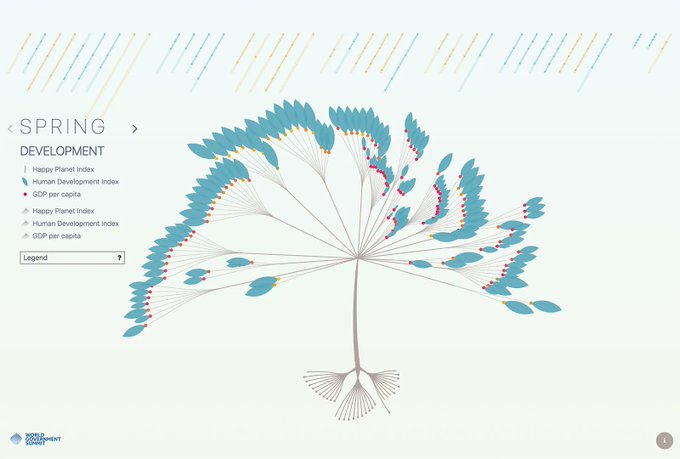

The Winners of the World Dataviz Prize 2023 — Information is Beautiful https://t.co/kTzzsu4udk

"How the Vast Spectrum of Data Fuels Your Data Visualization Project" https://t.co/MxHP6audiN This eBook examines a new spectrum of #dataviz & illuminates how meaningful projects can emerge from aspirational abstract concepts or from definitive numbers, & everything in between.


Gm with this combination of landscape and dataviz ☀️ If people like this style I'll post more of it :)
#genAI #ArtificialIntelligence #dataviz


A bit of (SVG) blurring around some lines gives a very nice effect I think! May have some performance impact for animations though...
[yes... theses are pie charts! :-)]
#dataviz


One of the latest experiments with @krea_ai and @midjourney designing #dataviz


Day 26 of the #30DayMapChallenge - Islands. 3D digital elevation model of Taiwan
This map was made with #Python using #Numpy, #matplotlib and #earthpy. #data #DataScience #data #dataviz #DataScientist #geography #artwork #art


At least 445 people have been killed since the beginning of protests in Iran including at least 63 children and teenagers.
Source: Human Rights Activists News Agency
#MahsaAmini #WomanLifeFreedom #dataviz

At least 300 people have been killed since the beginning of protests in Iran including at least 47 children and teenagers. Source: Human Rights Activists News Agency
#MahsaAmini #WomanLifeFreedom #IranRevolution #datavisualization #dataviz #infographic

Day 2 of the #30DayMapChallenge - Lines.
Contour line map showing the topography of Great Britain.
This map was made with #Python using #Numpy, #matplotlib and #earthpy. #data #DataScience #data #dataviz #DataScientist #uk #gb #eu #geography


A data visualization project I worked on last year was longlisted for the 'Information is Beautiful Awards' @infobeautyaward 😊😊😊!
https://t.co/ZKH2gQoBgA
#dataviz #Datavisualization


Simpler Presentations of Climate Change https://t.co/wjtBZW5vVG via @AGU_Eos #SciComm #DataViz #ClimateChange

Simpler Presentations of Climate Change https://t.co/5M2Cqdi8Lm via @AGU_Eos #SciComm #DataViz #ClimateChange

Simpler Presentations of Climate Change https://t.co/30B2tCG3ch via @AGU_Eos #SciComm #DataViz #ClimateChange

Simpler Presentations of Climate Change https://t.co/qSFafKH1Rr via @AGU_Eos #SciComm #DataViz #ClimateChange


In the last weeks our project Key Workers was selected for a STARTS Prize @arselectronica 2022 Nomination and my #dataviz for @la_lettura made it into the @dezeen Awards Design Longlist! Thank you for these recognitions to projects I care so much about.
#DataVisualization


The Average Sleep Patterns Of 40 Different Animals, Visualized | Digg https://t.co/20q6gsIUkV #design #infographic #dataviz #visualization