AnalyticsのTwitterイラスト検索結果。 480 件中 19ページ目


CNN using Feature Extraction and PyTorch. #BigData #Analytics #DataScience #AI #MachineLearning #IoT #IIoT #Python #RStats #TensorFlow #Java #JavaScript #ReactJS #GoLang #CloudComputing #Serverless #DataScientist #Linux #Programming #Coding #100DaysofCode
https://t.co/OzSps85uun


At least 13% of Bitcoin crime proceeds are now laundered through privacy wallets, according to a new report from the blockchain analytics company Elliptic https://t.co/hTzBatzMBo


harder to check analytics on here but i still get notes on these on tumblr at 25k and 12.9k respectively lmao


Came back to this cuz I finally realized/found out my most popular drawing.
A meme when I first joined the #obeyme fandom during the earlier days of the game. Lol.
I dont know how to use analytics but this still gets likes and stuff to this day. https://t.co/z0i1FdSsZn


[QRT with your most popular drawing]
Twitter analytics says it's this one 😈 https://t.co/P1qtvHRFxS


I had to use Twitter analytics, and wow, I didn't realize I got 249 likes on this. It's not even that good. https://t.co/wENoN7Uk5r


Reply or QRT with your most popular art:
According to my ArtStation analytics, this throwaway Elf piece was my most viewed piece since May 2020. Really?! I guess y'all like my totally frivolous Elf fluff! https://t.co/Aj87c1qFG0


Free Data Science Books. #BigData #Analytics #DataScience #AI #MachineLearning #IoT #IIoT #PyTorch #Python #RStats #TensorFlow #Java #JavaScript #ReactJS #GoLang #CloudComputing #Serverless #DataScientist #Linux #Books #Programming #Coding #100DaysofCode
https://t.co/DgkS3cAOQ3 https://t.co/Ub4FCLbQJX


https://t.co/QgSi42g0q9 Mars People since 2004 <200 pics #Airdrop #ai #airforce #VP #ML #artificialIntelligence #MachineLearning #deepLearning #dataScience #FemTech #robotics #BigData #IoT #automation #coding #digitalTransformation #algorith #analytics #BI https://t.co/QgSi42g0q9 https://t.co/QcDLExCTLz


According to my analytics expert, Frankendeer, we’re gonna hit 5k soon


% of #retail, #manufacturing and #logistics professionals who are currently investing in the following:
Warehouse automation 55%
Predictive analytics 47%
#IoT 41%
Cloud #logistics 40%
#AI 28%
#Blockchain 22%
#ML 16%
Autonomous vehicles 16%
@raconteur


"im not gonna stare at the analytics page for 600 years and drive myself insane im taking a victory nap n thats that"
me 2 minutes later:


Apache Pinot has now crossed 600 members on Slack! 🍷 🍷
A huge shoutout to the community for all the interesting conversations, ideas & contributions. We're so glad to have you!
Community invite: https://t.co/PhqFyGWYBL
#DataAnalytics #realtime #analytics #BigDataAnalytics


@lysadigiart Lol yeah I almost never make it to 10 likes and I have almost 160 followers. Twitter analytics says people just pass my stuff by 😔
Here's some recent stuff since this thread lookin like an art share rn


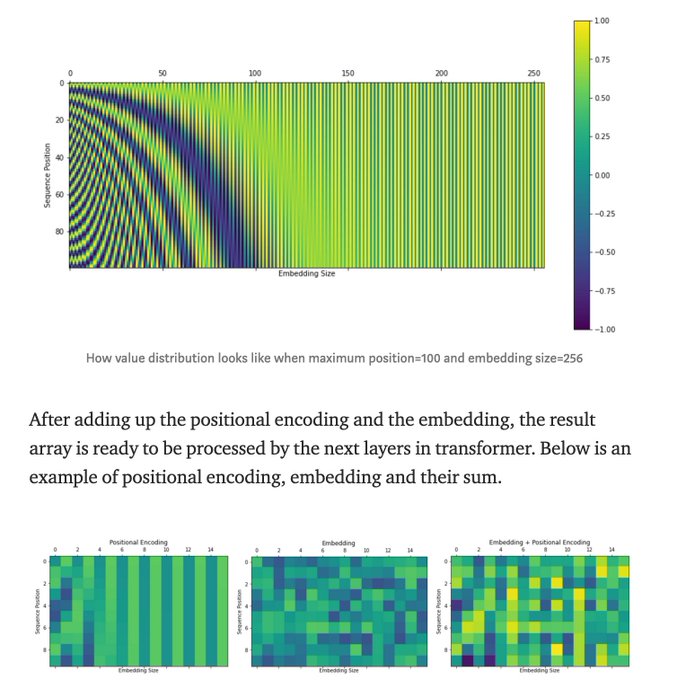

What Exactly is Happening Inside the Transformer. #BigData #Analytics #DataScience #AI #MachineLearning #NLProc #IoT #IIoT #PyTorch #Python #RStats #JavaScript #ReactJS #CloudComputing #Serverless #DataScientist #Linux #Programming #Coding #100DaysofCode
https://t.co/0ix5HE4A4g


I just checked the analytics for this and it has over 1500 plays....I think I'm gonna have a heart attack.