datavisualizationのTwitterイラスト検索結果。 65 件中 4ページ目

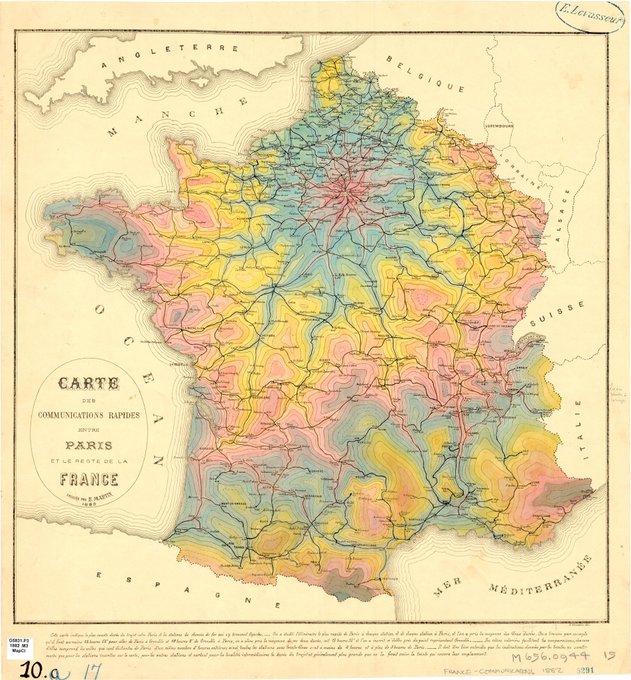
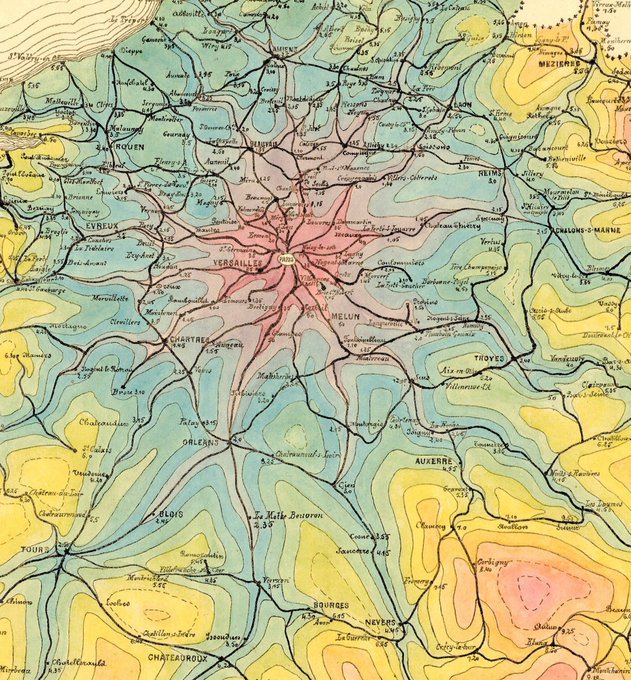
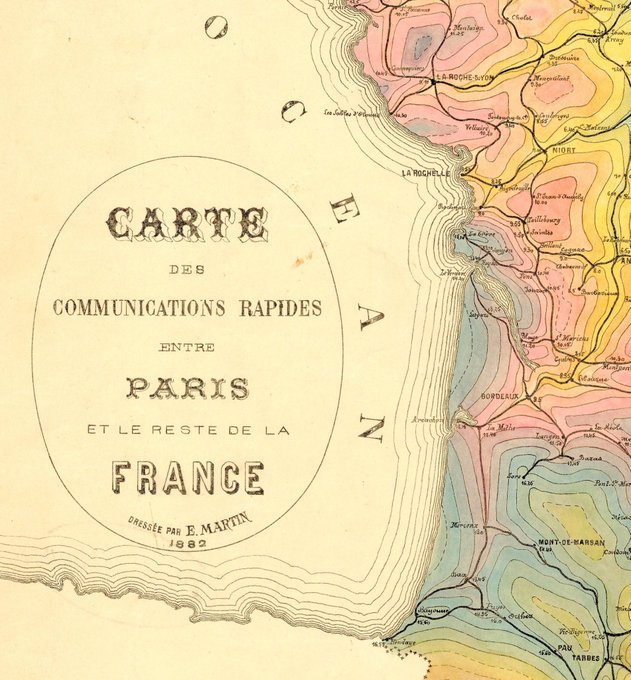
This is my new favorite French #map. Found this one in the University of Chicago map collection. The color choices are not what I expected from a #datavisualization made in 1882, but I'm here for it. This shows the travel times from Paris radiating out into the country.


#Dataviz narrative layers and #illustrations for The Map of Remote and Literary Islands: https://t.co/pMpo3cJhgD #infographics #datavisualization @La_Lettura


My new #dataviz for @La_Lettura is a visual exploration of the world of #MaryPoppins (and it's full of umbrellas! ✨☂️) #datavisualization #infographics

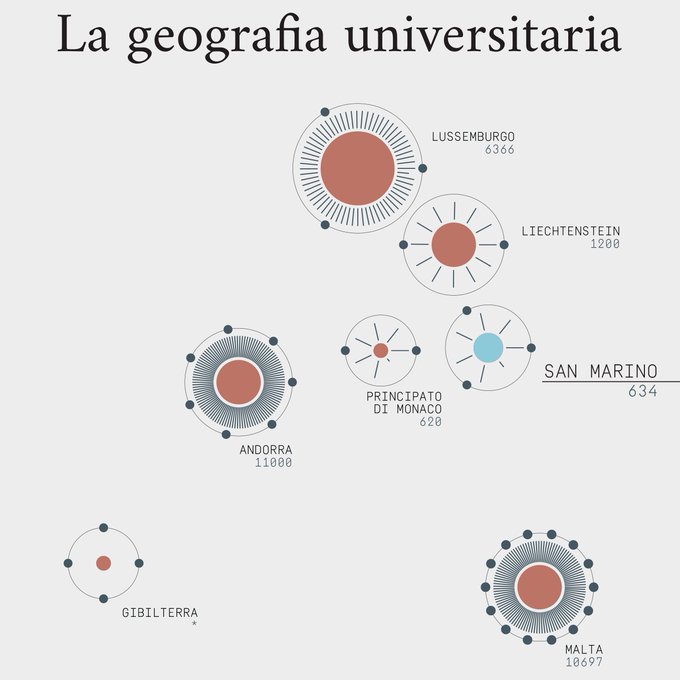


Amazed by our #dataviz workshop students' projects! Working with them was such a pleasure, we had a great week at @unirsmdesign! @francesco_majno #infographics #datavisualization
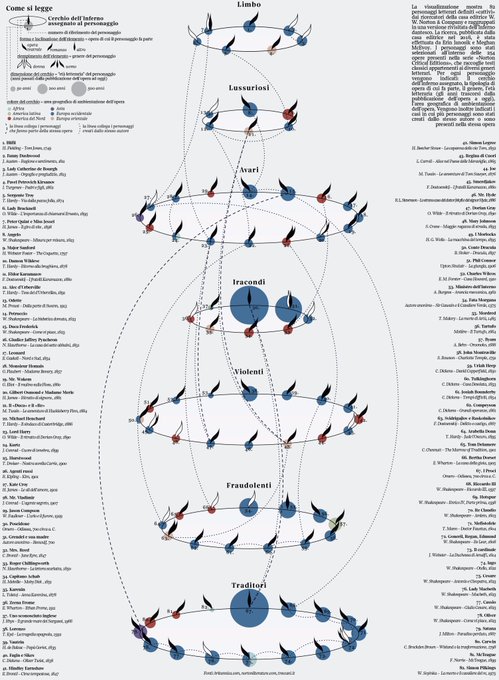
Villains in #literature: my #dataviz for @La_Lettura on #Behance! https://t.co/PAyFhD1H2H #datavisualization