visualizationのTwitterイラスト検索結果。 865 件中 44ページ目


The "Atlas of Infographics" compiles 280 contemporary data visualizations: http://t.co/x4XDCX9i3L
47
56


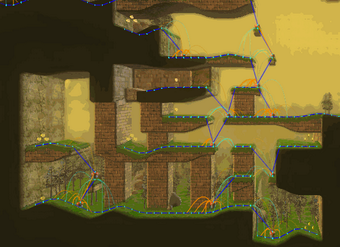
3D Visualization assignments from the Term 3 FZD students - https://t.co/KXfUh0P56l
1
3


"I See a Future" by @OnnyRananta, an artist from Solo. As he said of his works, "A heart-telling visualization".
1
0
もし、気にっていただけましたらTwitterやブログで宣伝していただけると管理人が喜びます。
ツイートする