30daychartchallengeのTwitterイラスト検索結果。 3 件
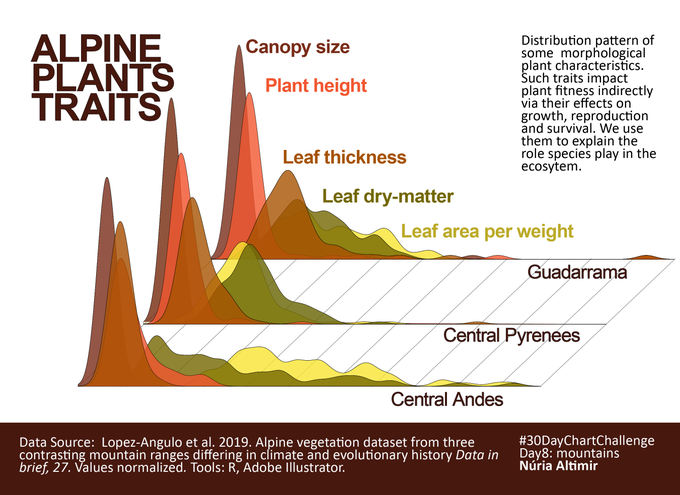
#30DayChartChallenge Oh, surprise, ridgeplots via R for #Day8 #mountains .Data from @JesusLopAng #DatainBrief This is a lot of field work, but I imagine so much good views and fresh air...jealous of practicing field biologists indeed.
#30DayChartChallenge Day 10 - Abstract.
All of the code to produce this came from @mf_viz (linked below). I thought it'd be fun to do his method with some of the work from @h0rdur who takes mind-blowing photos of landscapes in Iceland (follow him on Instagram!)
Day 4 of #30DayChartChallenge - "magical". I chose to visualize the highest-grossing Studio Ghibli movies using #rstats and this may be my favorite visual I've ever created just because Totoro is in the corner.
Code: https://t.co/rXHrGABsYV
Source: https://t.co/QRXkPiVDYT


