Sentinel5PのTwitterイラスト検索結果。 1 件

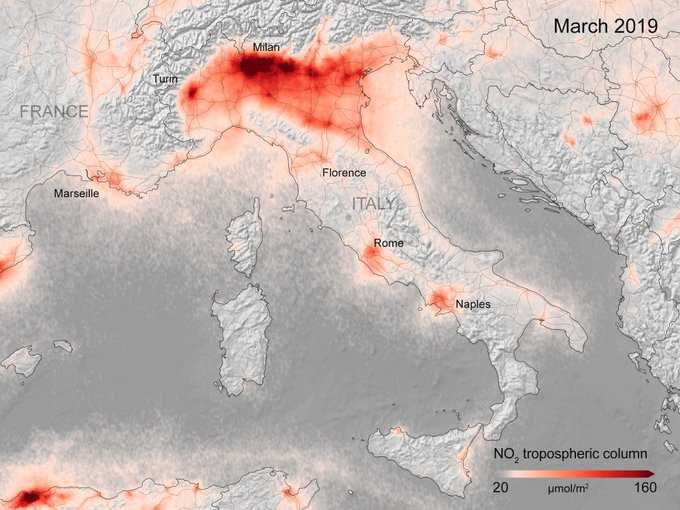
New #NO2 map available for #Italy- based on data from @CopernicusEU #Sentinel5P and processed by @KNMI/@esa.
🛰️images show nitrogen dioxide concentrations from 14 to 25 March 2020, compared to the monthly average of concentrations from 2019.
Read more: https://t.co/0gXGSaJAed
210
351
もし、気にっていただけましたらTwitterやブログで宣伝していただけると管理人が喜びます。
ツイートする