
Datawrapperさんのイラストまとめ
@DatawrapperFollow @Datawrapperさんをフォローする
フォロー数:617 フォロワー数:26809


We just published our latest Data Vis Dispatch! We collected the best charts & maps of the last two (exciting!) weeks, covering the Queen's death, a hurricane, territory gains in the Ukraine, birds, and – of course – the climate.
Find it all here: https://t.co/AdWdCfqgIo


Out now: our latest Data Vis Dispatch! We collected the best #dataviz by more than 25 news organizations (and six individuals) from the past two weeks, covering everything from the floods in Pakistan to gas prices and baby names.
Find it all here: https://t.co/KerdfAIDmQ


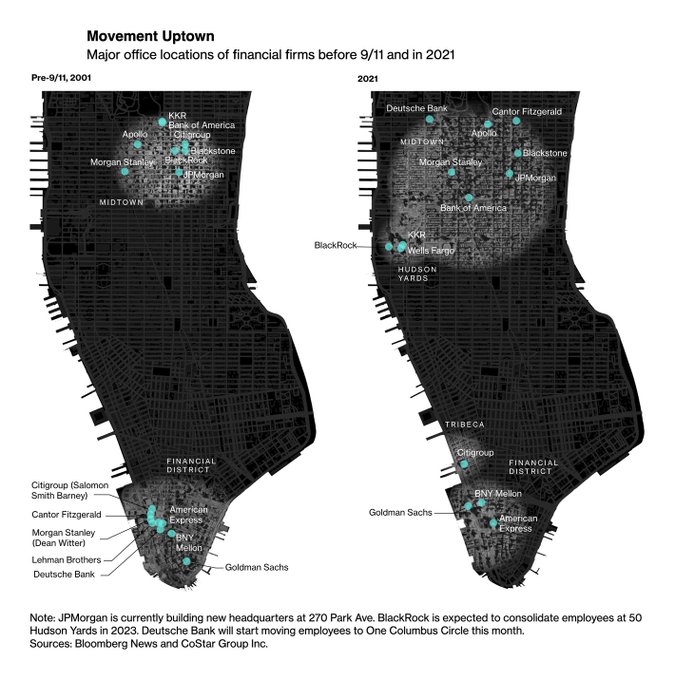
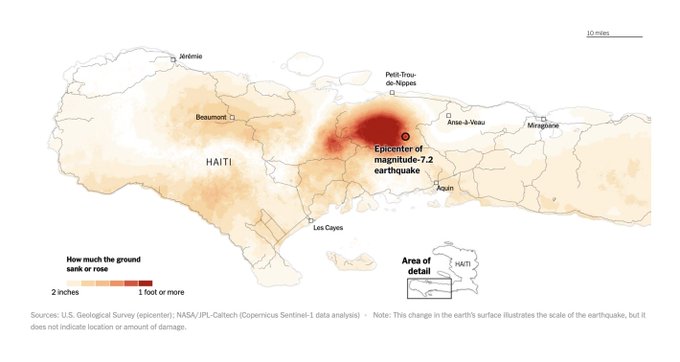
New Data Vis Dispatch! And it's full of beautiful maps 🗺️
After today, we'll be taking a little late-summer break and publishing the Dispatch only every other Tuesday until the end of September 🏖️
See more of this week's best on our blog:
https://t.co/Cuzeb1R4t8


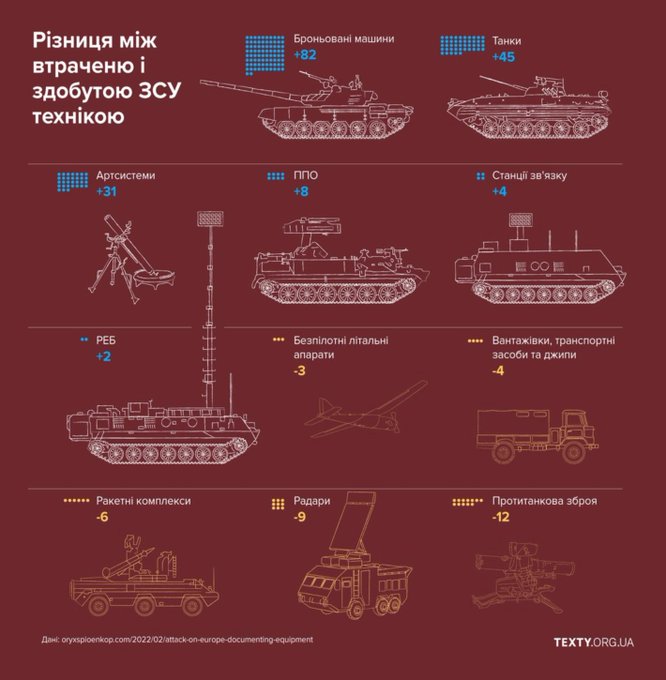
We just published a new Data Vis Dispatch. It's another big week for maps — of war, politics, energy, and more.
Find more on the blog ➡️
https://t.co/iL8xOyRFhI


We just published a new Data Vis Dispatch! This week, you'll find more #dataviz about the war in Ukraine, as well as housing, consumer waste and much more.
Check them out here:
https://t.co/DBoNaQJRQR


We just published a new Data Vis Dispatch. This week has many more charts and maps on the war in Ukraine, as well as sections on COVID-19 and climate change.
Find them all here:
https://t.co/xbPeUHRkuo


Also, don't miss our great "What else we found interesting" section this week, with visuals by Nancy Organ, @nytgraphics, @ReutersCarrel & Samuel Granados, @NatGeo, and @matteofarinella 👉 https://t.co/sqUTDcr2wK


Our latest Data Vis Dispatch is now out! Tune in this week for some interesting elections charts 🗳 coming from Canada, Argentina, Germany, Hong Kong, and California, some #dataviz on #covid19 🦠, and long term climate data:
https://t.co/xYklUchQ5M


We just published our latest Data Vis Dispatch! This week: A new wave of COVID cases, the NATO withdrawal from Afghanistan, and your favorite simple charts with some uncommon twists, by @nytgraphics @flowingdata, @funkeinteraktiv and others.
Have a look: https://t.co/6lkMUaBPh5

Great use of our heatmaps in this article about #covid19 incidence across Spain by @kikollan for @el_pais.
💡#CreatedWithDatawrapper
Check out their full article here: https://t.co/weG9tDfswU