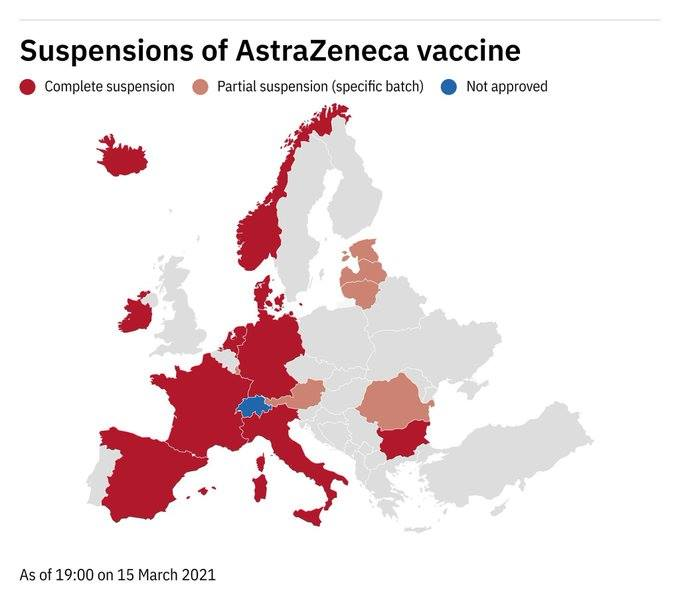
Excellent reporting, with lots of pictures, drawings and maps https://t.co/O6RXzArcCG
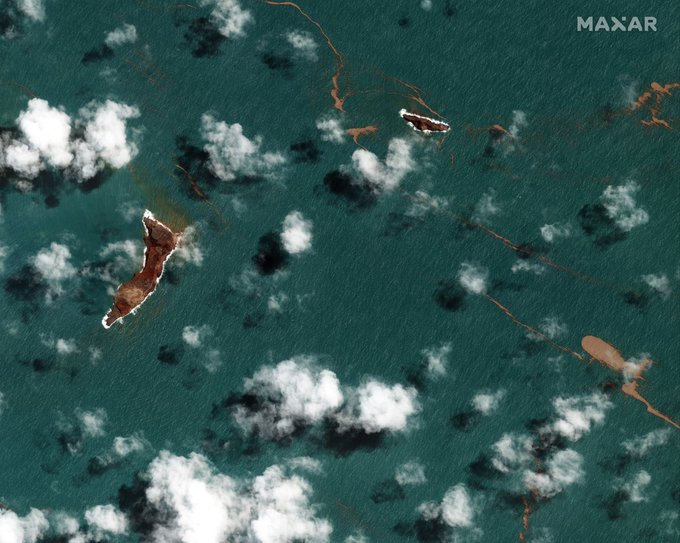
Before and after @maxar images of the volcano and of Tonga capital Nukuʻalofa https://t.co/AjdAPoeO6S
[NEW] The 2021 List of Visualisation Lists is here! https://t.co/8VQGhYbz41
Did I miss one? Let me know!
[NEW] Last time I updated my portfolio was 20 months ago, so high time for an update :)
Visualizing a genome collections with CactusTrees https://t.co/LLyZf6Xxlc
Hieruit kan een kaart afgeleid worden van zones die het dichtst bij een vaccinatiecentrum zijn gelegen, maar die toch aan een andere centrum zijn toegewezen (rood op de kaart). Een niet onaanzienlijk deel van het Vlaamse grondgebied 4/6
Back in my time at @tijdgraphics, I got my hand on real estate price data at high geographical resolution. I made static maps for a couple of cities that were printed in a special. Maps were almost entirey made in @qgis https://t.co/hy4Eojl3ct 2/12
Very interesting read on the current state of research around color in data visualisation https://t.co/5nt9TiMuX2
My take away idea: when the data and/or the task of the viewer requires it, just use non-perceptually uniform color scales!
Maar de communicatie is "Je mag maximaal 4 mensen uitnodigen, en die 4 mogen geen andere mensen bezoeken" Er wordt niets gezegd over of deze 4 bezoekers daarna ook zelf nieuw bezoek mogen ontvangen. Mag dat? 3/


