
Maarten Lambrechtsさんのイラストまとめ
@maartenzamFollow @maartenzamさんをフォローする
フォロー数:1803 フォロワー数:20849


Love this: decision diagram to identify European languages based on letters
Posted on Reddit here, can't find real source https://t.co/vCcYOhohm4


[NEW] The 2019 List of Visualisation Lists is already here!
https://t.co/auNeb9t6Ri Very incomplete still, so send in your "2019 in graphics, maps and illustrations" lists!


For #30DayMapChallenge I made 1 map on each day of November. You can find all of them in this thread, or with some more context on https://t.co/Rxq7W35yiD Thanks to all 30DayMappers, you were amazing! https://t.co/c1ndr9oyZ0

@f_l_o_u_r_i_s_h @Stad_Antwerpen @hnshck @igeolise @Runkeeper @karim_douieb @Datawrapper #30DayMapChallenge nr 30 (home): A map I've been wanting to make for a long time. Places I've called home throughout my life (circles) seemed connected to the river Demer (blue) and the E314 highway (pink). Looking at the map now, they definitely are
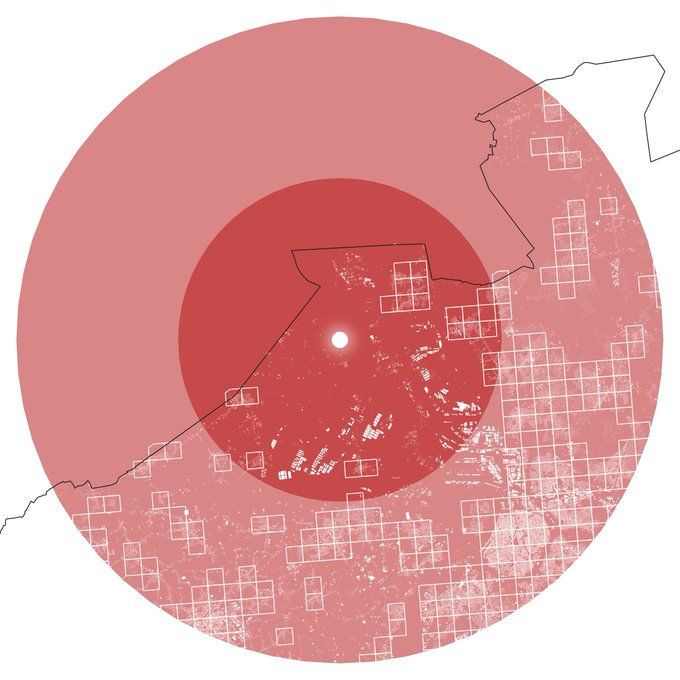
@f_l_o_u_r_i_s_h @Stad_Antwerpen @hnshck @igeolise @Runkeeper #30DayMapChallenge nr 17 (zones): some 820.000 Belgians live less than 20km away from the Doel nuclear power plant (not counting the Dutch to the north). Squares = 1x1km with pop > 500, Antwerp city center in lower right corner
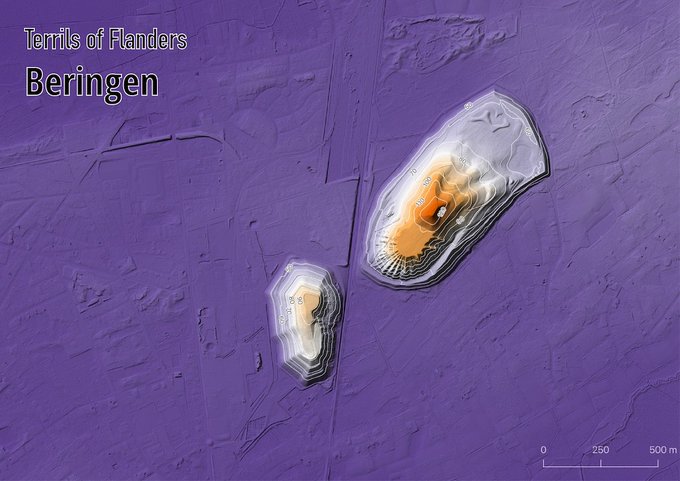


@f_l_o_u_r_i_s_h @Stad_Antwerpen @hnshck #30DayMapChallenge nr 11 (elevation): The Terrils of Flanders (that's how we call spoil tips or slag heaps here)
Very pleased with these ones


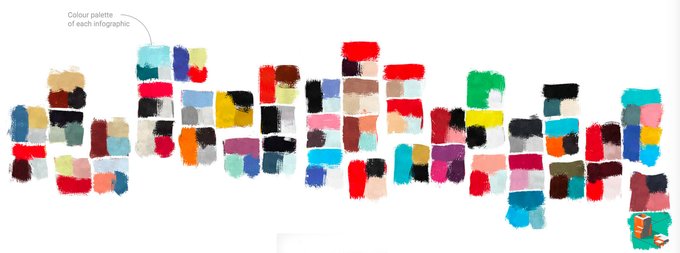
This sparks *a lot* of joy (in an otherwise very awful ux process)