
Simon Kuestenmacherさんのイラストまとめ
@simongerman600Follow @simongerman600さんをフォローする
フォロー数:215207 フォロワー数:264446


Map shows the range of reindeer population (numbers are distinct herds). Smart choice of a map projection too. I like what I see. Source: https://t.co/ifUkRaVltG

Living history. Map shows the location of every city founded by the Roman Empire outside of modern day Italy. Source: https://t.co/55XZiqbi4h

Gain geographic bragging rights by using this map projection at some stage just to be able to use the term "Hellerick boreal triaxial projection"... Source: https://t.co/zDTocuSGh0


Comparing satellite images of Iceland during winter and summer it becomes evident that the island deserves its name. Image source: https://t.co/DyJO2E5u4w

Animated map by @NASAEarth shows 21 years of global snow cover. Source: https://t.co/s4fd1jzG51

Nothing but the roads of Canada. Source: https://t.co/VJOUPloKlP

Breath. Here is Earth. All of 2020 summarized in one wonderful animation. This is based on 3 petabytes of satellite data. That's 3,000,000 GB or the storage capacity of 6,000 standard laptop hard drives (at 500 GB each). Source: https://t.co/bTzvgPbDiU


Hilarious map by @alfred_twu shows every Chinese city. It's a homage to the hilarious map of every European city by @ItchyFeetComic.
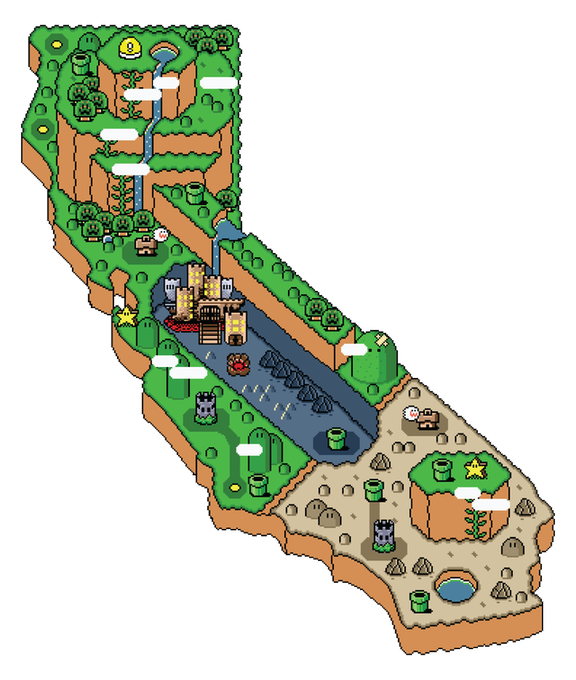
Stumbled across another Super Mario cartographer. Here is California in the Super Mario look. I like it! Source: https://t.co/mUDYMxQqeC


The two maps show the air force aircraft markings of the European nations in 1938 and today. Source: https://t.co/I0necH7lej