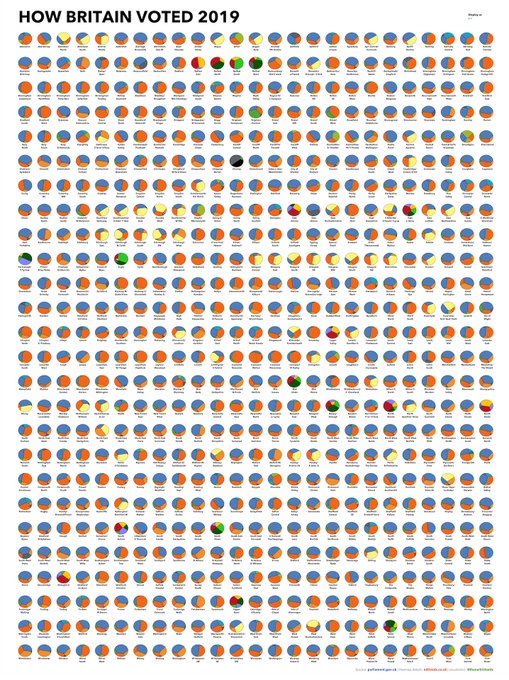
@danz_68 Treemaps in pies, you say? I have 1300 of them right here, of the Voronoi persuasion ... https://t.co/coENZU1d11
I don't have the coding skills to participate in #genuary2022 but I'm loving the submissions, learning so much new stuff and getting great #datavizinspiration. Today is all about Sol Lewitt's Wall Drawings - I'd never heard of him before but I absolutely love this!
This is supposed to be this week's #makeovermonday #viz5 creation. Instead, I've got this by mistake, and I like it!
USA county tile maps are tricky ... I'm beginning to realise why I've never seen one done before! Not giving up just yet ...
@tmbg @tmbw Day 28 of #31DaysOfFlood - this time looking at letter count across every song of @tmbg's Flood album.
How Britain Voted 2019
On @tableaupublic at
https://t.co/5EfIWDsKIG - also my entry for #SWDchallenge small multiples!
Thank you @latadaviz for the Voronoi Treemaps @tableau tutorial and assistance converting 1 into 1300!
Original @observable voronoi example from @W_R_Chase
NEW: Questions in Dataviz - How can we visualise decimal numbers? https://t.co/sWq70wQ55o where I solve the question to the Ultimate Answer, use the word "repetend" lots, and feature @LearnVizWithMe @nheilman @ChrisLuv
@StatHunting @pauliface @tableau The walk is arbitrary inasmuch as you turn four corners before continuing in the same direction. I put in a parameter to change that - if you turn 6 corners (60 degrees each time instead of 90), you get a completely different end. Look at 82 now, and look at e.g. 7!
NEW: Questions in Dataviz: Does it matter if shapes overlap in a visualisation? https://t.co/a0C6zzBOYb - features a brief look at the design process behind my recent @DataVizSociety challenge viz with a nod to @ProfDrKSchulte


