visualizationのTwitterイラスト検索結果。 1,044 件中 52ページ目


Science visualization in action via #scicomm--Dive in and explore #marinereserves #research! http://t.co/xvbaBZL8u2


SCIENCE VISualizations for the 2016 #VIZZIES – due next week! Submit by 9/15 http://t.co/yxTYUrB43K #SciArt #BioArt


Version 0.8.2 is here: publish packages locally, Node2code, analysis visualization. http://t.co/0Y5lhSUuPC. Enjoy.


STUART BRIERS ILLUSTRATION: VISUALIZATION
http://t.co/f5GdaJsJwK
#illustration @RappArt


#generative #art - audio visualization with #code (#processing). more at http://t.co/0diTO3DDPU


How to create an awesome data visualization http://t.co/FRd4ynhG5h via @danielzeevi on @DashBurst #Dashburst #Design


A Proportional Visualization of the World’s Most Popular Languages http://t.co/kfQNjWPm6b


CALL for SCIENCE VISualizations, #SciArt, #BioArt for the 2016 #VIZZIES!! http://t.co/yxTYUrjsFa by 9/15 @NSF @PopSci


next #infovisfhp talk 3 June: Nina Valkanova on social public visualizations of citizen data http://t.co/tNRZ9leCtd


Ever imagined where Jane grew up? Production Designer @darawishingrad's visualization of Jane's home #Consumed


#D3 on #AngularJS - Create dynamic visualizations with AngularJS
Download now for free!
http://t.co/0gG7JYW77r


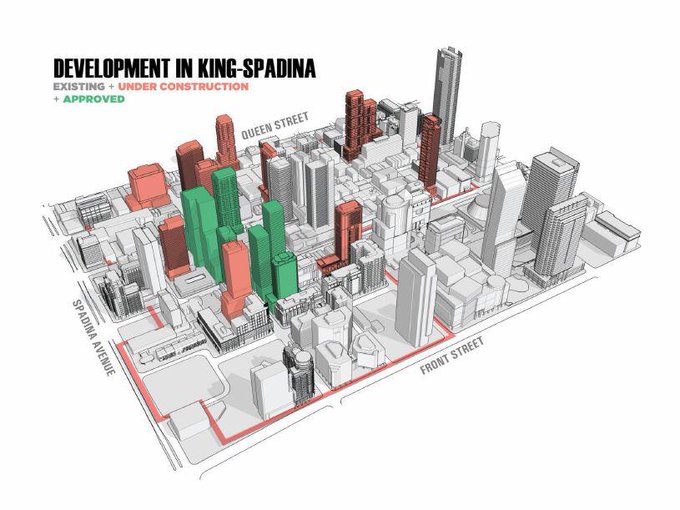

Fascinating @CityPlanTO visualization. Dev in King-Spadina:
- existing
- under construction
- approved
- proposed


Interactive #3D visualization is used by the furniture online shop.
https://t.co/ZCg0MIvtR1
#blend4web #b3d #webgl


5 data visualizations in 5 minutes: each in 5 lines or less of #R
http://t.co/I7LF5XKynk


The "Atlas of Infographics" compiles 280 contemporary data visualizations: http://t.co/x4XDCX9i3L


Nice visualizations of Android vs iOS by analyzing tweets: http://t.co/U13BRU47sb


3D Visualization assignments from the Term 3 FZD students - https://t.co/KXfUh0P56l


Wow, this visualization of #marriageequality in the US shows so much progress! http://t.co/yAaR3Oz7gh


song visualization
http://t.co/YxHH93mhar
#procedural #gif #processing #art #visualsound