ggplotのTwitterイラスト検索結果。 146 件中 8ページ目
@aschinchon @DataCamp This course is great, it filled in a lot of my #ggplot2 knowledge gaps. Thanks! I made a purple prairie clover flower interpretation. Thanks for the inspiration @prairiestrips
米国デューク大学の社会学者によるRを使ったデータ可視化の決定版。疫学界隈でも購入者が相次いでいます。
ggplotの使い方はもちろん、効果的なグラフの見せ方も学べるのでRユーザーでなくてもよさそう。早速ポチりました。
https://t.co/VJ9x5U5MzC
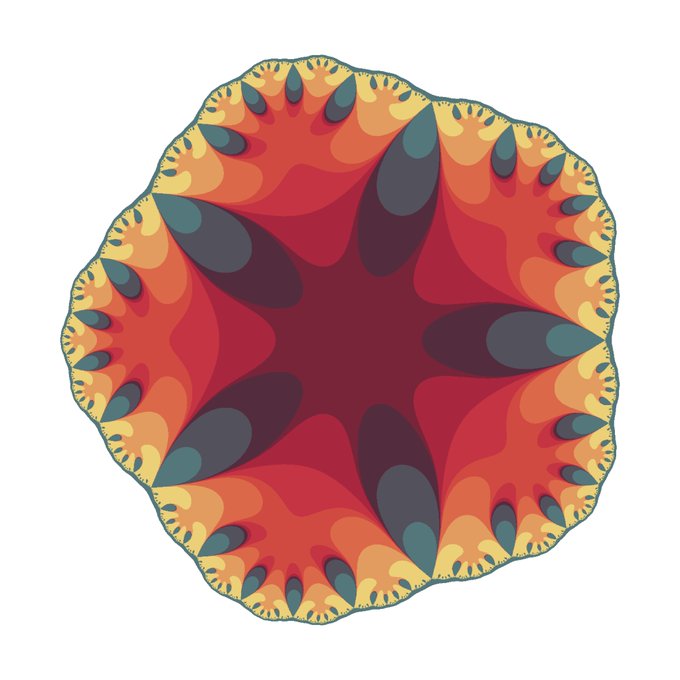
6.250.000 números complejos, transformados repetidamente y pintados con #ggplot en unos cuantos segunditos con un portátil normal y corriente #rstats #tidyverse #matematicas #creativecoding
Frankenstein #rstats #ggplot2 #maths https://t.co/FAzAiLJBg0 (w/code)
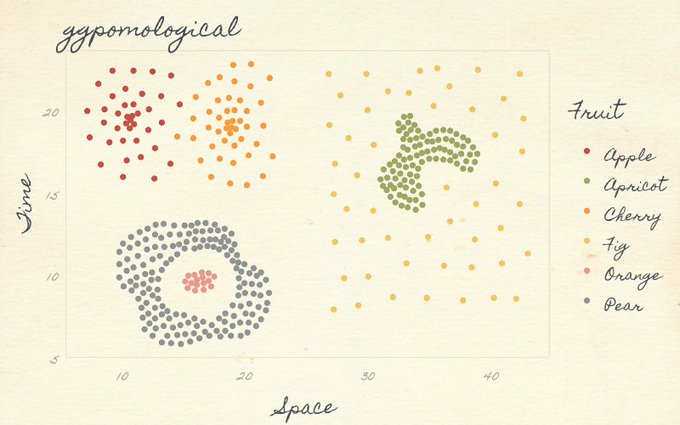
😍 pomologically-inspired plots…
"🍑 ggpomological: A Pomological ggplot2 Theme" 👨🎨 @grrrck
https://t.co/Bqj6ZibwwM #rstats #dataviz
Some very nice plots (+ #ggplot code to make them) in this solar panel analysis blog post by @JeroenBoeye https://t.co/mqeicJqGZa


