ggplot2のTwitterイラスト検索結果。 126 件


New to R? Learn how to create customizable data visualizations using ggplot2 with this tutorial. Increase visibility and improve repeatability with a range of visualization options that go beyond point-and-click software
#dataviz #Rstats
https://t.co/FZUR7IXSK0


Fractalic Sushi 🍣
Code available here:
https://t.co/P33ErjAPVZ
#rstats #generativeart #maths #ggplot2

Eclipse: a #generativeart piece based on Physarum Model and inspired by nature (oil on #ggplot2 canvas)
Code available here:
https://t.co/iOYQW1my95
#rstats #maths


Heads Will Roll 02. Created in R with GGPLOT2. One million grid points and more than 400 shapes. #genartiveart #genartclub #wip #Rstats #rtistry #nft #creativecoding


More fun with #Rstats flow fields - worked examples coming soon! #Rtistry #creativecoding #ggplot2


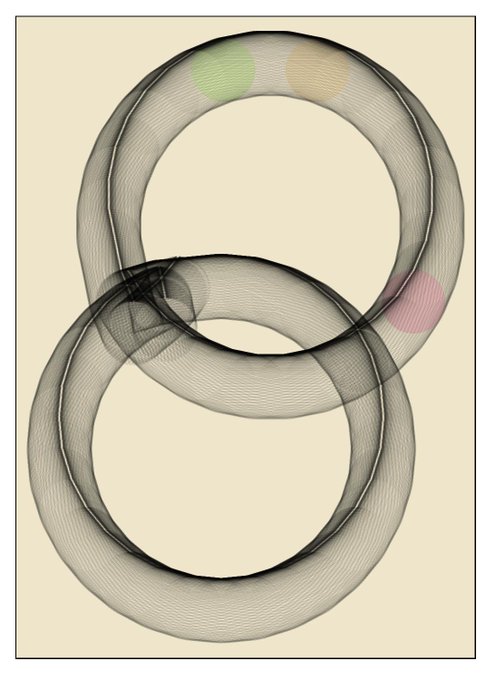

Rings 💍
(mere straight lines on #ggplot2 canvas)
#rstats #maths #generativeart


Bagels (mere straight lines on #ggplot2 canvas)
#rstats #maths #generativeart

