visualizationsのTwitterイラスト検索結果。 93 件中 2ページ目


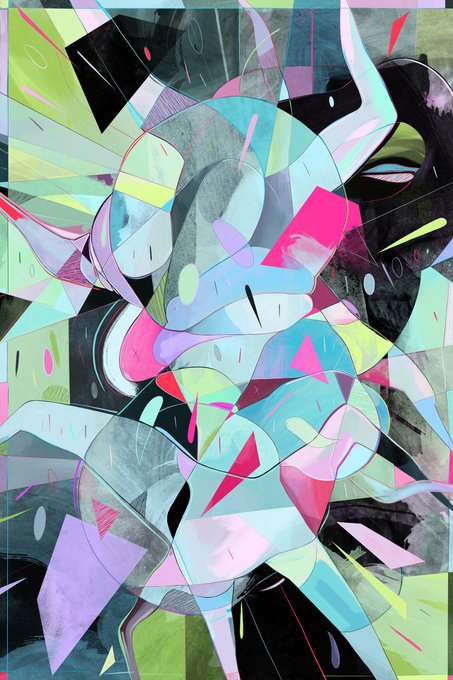
@MariMigraine expresses her experience with migraines into frighteningly stunning visualizations. Her ability to capture the intangible pain into artistic forms is a powerful creative feat. She utilizes vibrant contrasting colours and abstract forms to great success. <3


4/ As an architect in RL, I am used to deploying various computational tools and methods in my workflows, integrating algorithmic design processes, dealing with architectural visualizations. I am also teaching those in different platforms and schools.


Having to mess with rendering in Salt and Sacrifice today, I took a moment to capture some visualizations of the scene composition. Meshes generated on the fly with my XNA -> Unity framework.


Been working on implementing an octree image quantization algorithm in Python. The best thing about it are the visualizations 🤩.
Before and after reduction of the octree.
#python #graph #visualization


One of the sickest Sentinel-2 visualizations I have ever seen from @erindataviz. Full write up with code snippets and everything here: https://t.co/Aobbi7Cucb


indeed, they are words, characters built from an alphabet. Stock images are plain visualizations of the tags used to retrieve them. Everything is conventional in this picture, except the final picture. https://t.co/GHo4NYDBGC


My work is an investigation of consciousness, the human condition, technology + the universe. Using abstraction, I create visualizations of these different, yet interconnected subjects. Painting is a way for me to explore and understand how it is that we're here.


Sometimes those illustrations go their own way (here's e.g. an earlier draft of above's reconstruction of #PlantFood processing at #GöbekliTepe).
That's the fun in #visualizations: discussing all this fascinating research with the colleagues - and adding new results on the go.

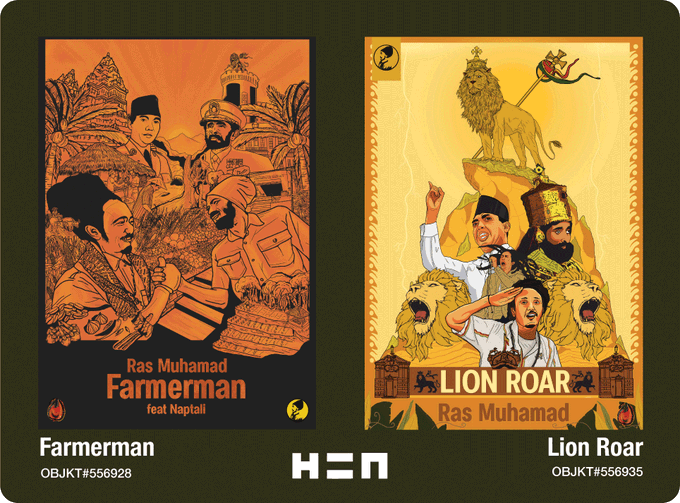
DROP DEBUT🔥
Wah gwaan?
Greetings from Jakarta, Indonesia🇲🇨
Exclusive. Drawn in 2017 to fulfill my undergraduate requirements. These artworks are two visualizations of Ras Muhamad's five songs from the album "Salam". Represents the songs "Farmerman" and "Lion Roar".


@Gozutrucker69 This do anything for you. Keep in mind picrew makes my visualizations limited


New SOF-ELK release is now live!
- Elastic stack components 7.15.0
- LOTS of cloud parsers for AWS, GCP, Azure, and Microsoft 365
- Dashboards and visualizations all updated for the latest stack
Download, feed, and examine! Details and download link: https://t.co/P9PKBwdqLy

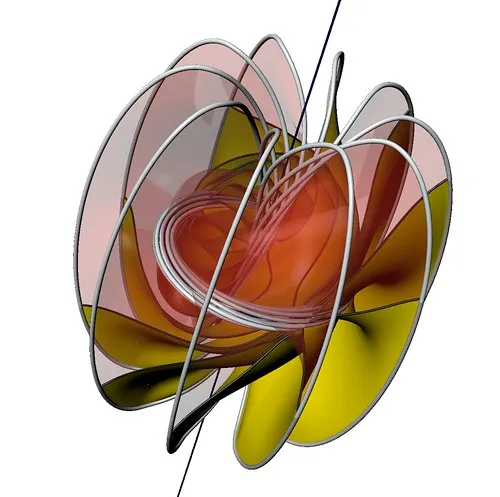
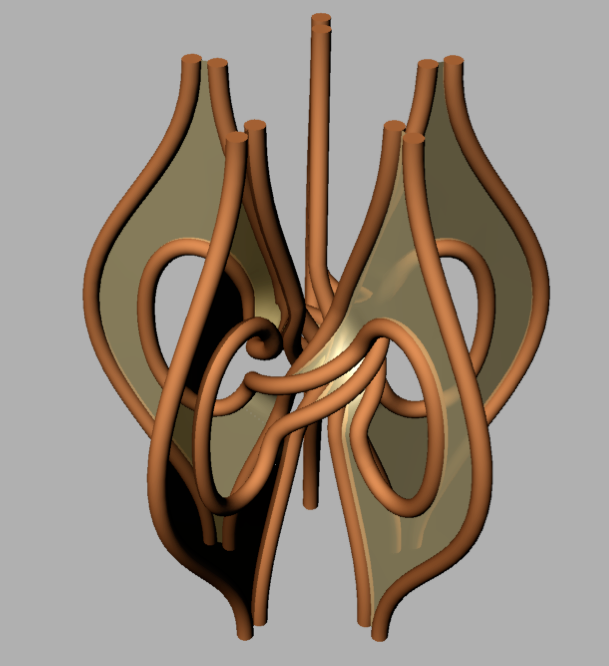

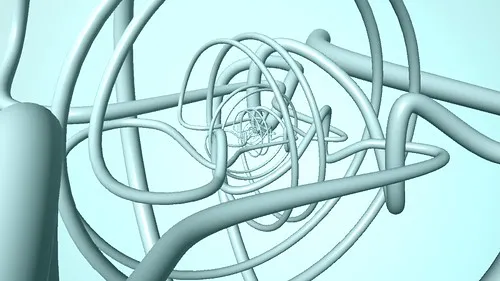
Today I discovered a treasure trove of pretty math visualizations from about a decade ago!
https://t.co/BJlwdPilDW


Nancy Burson's "Visualization Image (Breast Cancer)" is part of a series of side-by-side scientific visualizations created to demystify issues around disease and health for the general public—on view in "The Human Environment": https://t.co/baIxYIKeGh
#BreastCancerAwarenessMonth


Here is a first idea of what ggseg could look like in Python for ROI-based cortical visualizations. Ping me if interested.


From Satellite Nucleic Acids to Giruses, our definition of what constitutes a virus is broad and fuzzy.
This why visualizations like these are so helpful:
https://t.co/K2SKwczNgQ

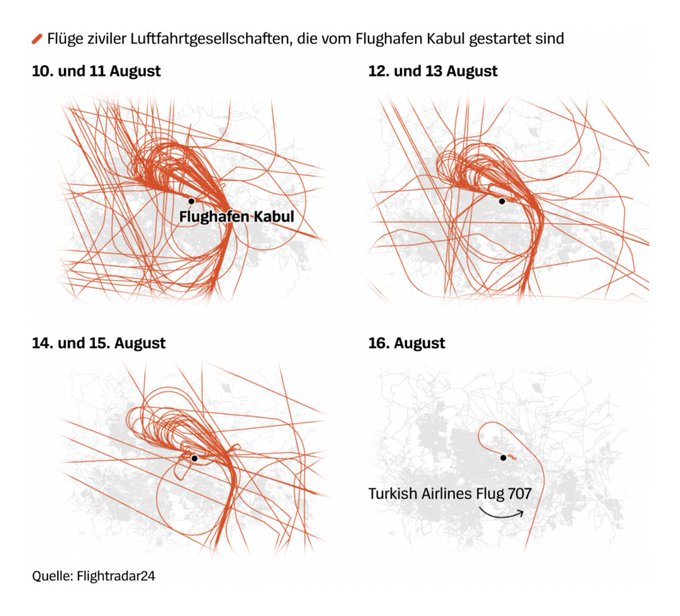

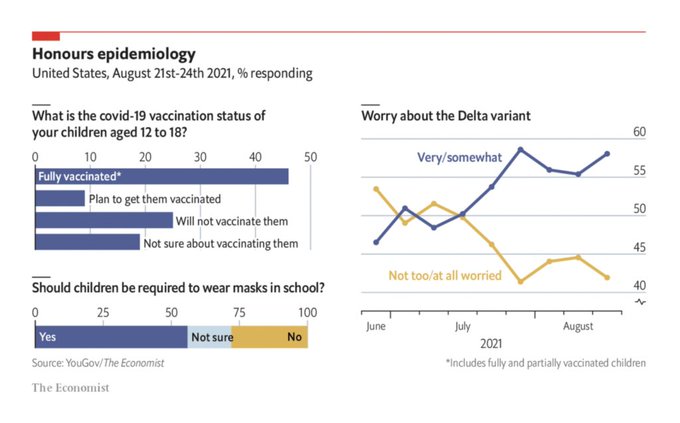

Great collection of interesting, recent visualizations.
Data Vis Dispatch, August 31 by @Datawrapper
https://t.co/BQpFvl8xdZ
#dataviz #statistics


I'm impressed by the quality of the IPCC visualizations – most newsrooms changed very little when rebuilding them, which is always a good sign.
If you haven't seen it, I can recommend playing around with the IPCC Atlas, their great, new exploratory tool: https://t.co/kOe8ebYUyO