datavizのTwitterイラスト検索結果。 253 件中 12ページ目


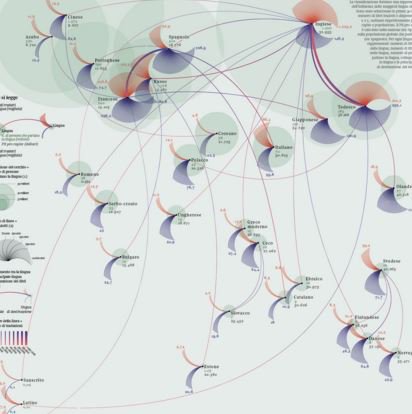
Cibo e letteratura: la mia nuova #dataviz illustrata su @La_Lettura! #vivalaLettura #illustration #datajournalism


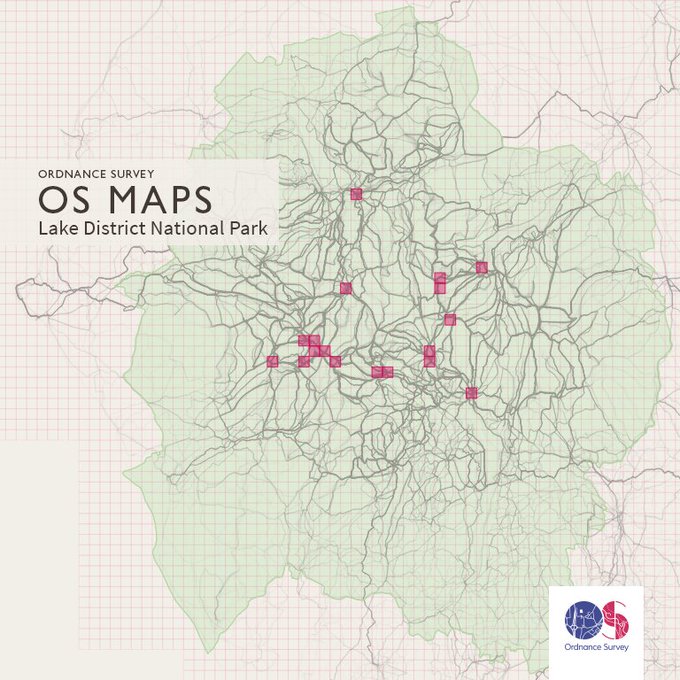

Britain's most popular grid squares in OS #Maps https://t.co/K9vcxThhZc #dataviz


8 Best Data Visualization Blogs: Make the Internet Smart & Beautiful https://t.co/ERTHXt6Kvt via @infogram #dataviz
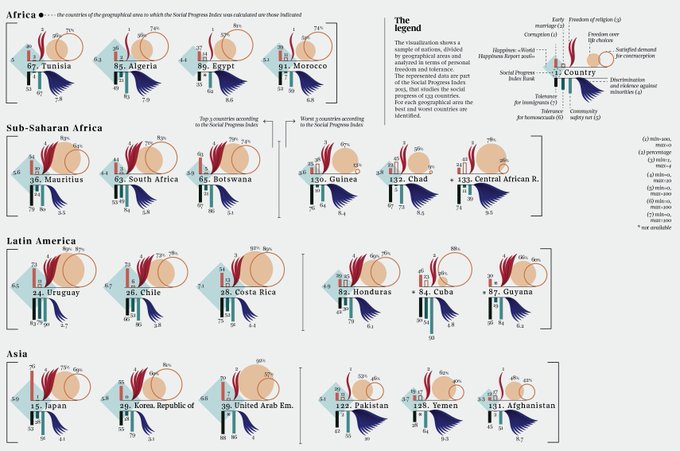
#SocialProgress – Freedom and tolerance by country. My #dataviz on #behance https://t.co/k00vTSxV9C #datajournalism


Who needs #music genres when there is data? #dataviz #DataScience
https://t.co/T708SrGTFj


'Chemical Atlas or The Chemistry of Familiar Objects' by Edward Livingston Youmans (1855) #infographic #dataviz


NEW: This week's featured #dataviz #infographic designer: Federica Fragapane (@frcfr) https://t.co/HQKQhjEVpt

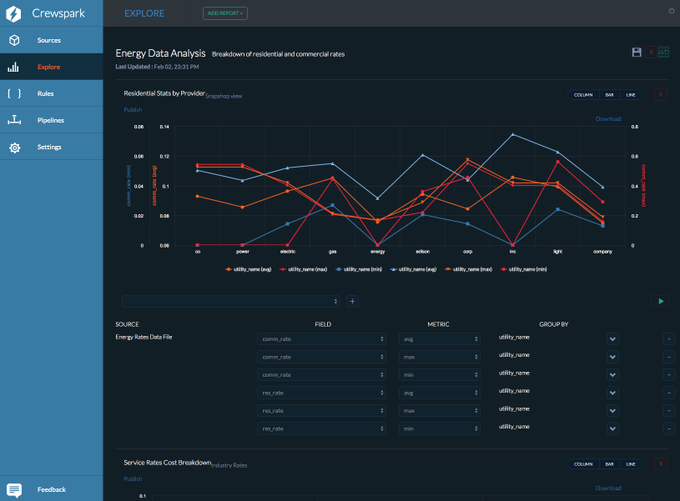
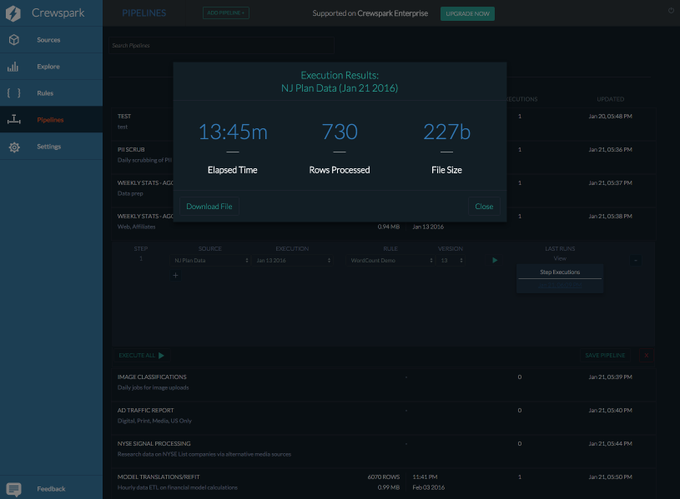

Data collection & discovery @crewspark #analytics #datascience #bigdata #dataviz https://t.co/WW9ylUDENV

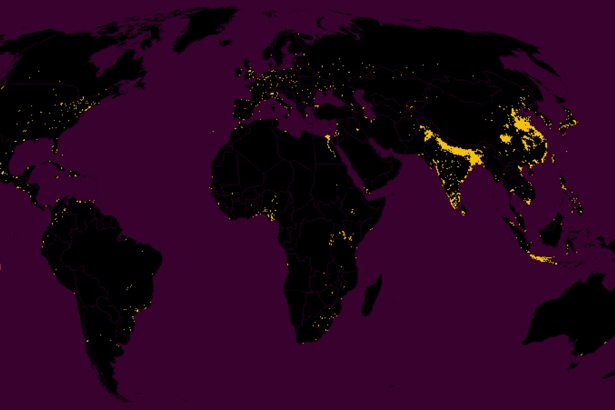
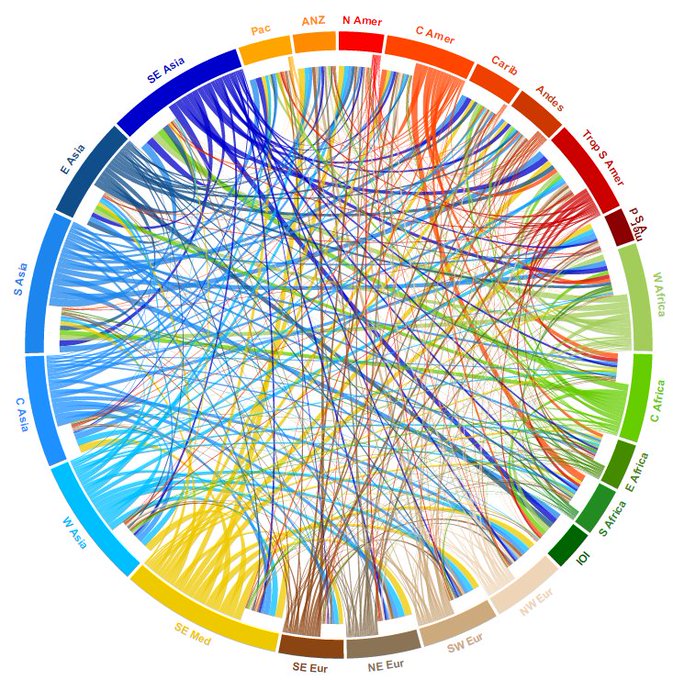
South & East Asia = 46%. Mapping population density around the world @TheAtlantic #dataviz - https://t.co/EEiXZ0i1sh


Network analysis and visualization with #rstats & igraph: #NetScix16 tutorial https://t.co/nlH1RO2Fm6 #dataviz #sna
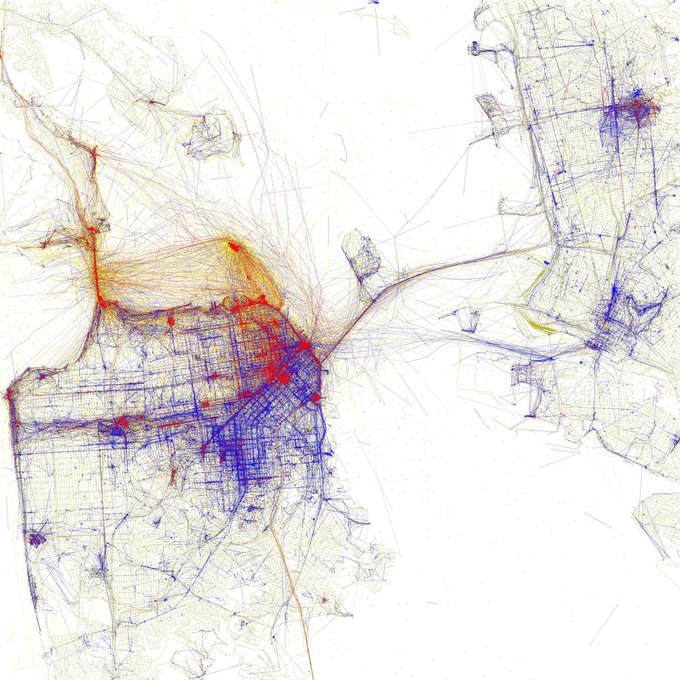
January: Where pics are taken in San Francisco by tourists (red) and locals (blue) #dataviz
https://t.co/w6WsLE7zKR

A few #illustrations+#dataviz never hurt anyone! Wip: https://t.co/7lY6pqiyTE

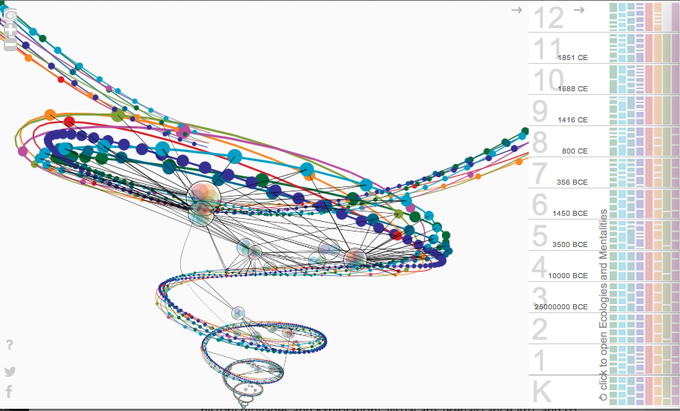
Nice @FastCoDesign article on Ross curriculum #dataviz model created w/ @moebio & @protozoo! https://t.co/yJwKMPcTYu


Mapping the frenzy of Europe's migrant crisis: https://t.co/9rWVDXhqDO via @CityLab. #dataviz


Petite #dataviz légère du lundi matin : les pires habitudes de vie en commun (UK) http://t.co/NFOJQ966r7


Hot damn, @ffranchi’s #dataviz, design & typography are just fantastic: http://t.co/GsXypihtO0


Estudo de Opinião Eurosondagem S.A. para @expresso e @SIConline
http://t.co/LE1ZLVfqu3
#legislativas2015 #dataviz


This weeks most memorable #contentmarketing using good data! http://t.co/J7rbZOokEd *30th edition #dataviz #ddj