INFOGRAPHICSのTwitterイラスト検索結果。 396 件中 19ページ目


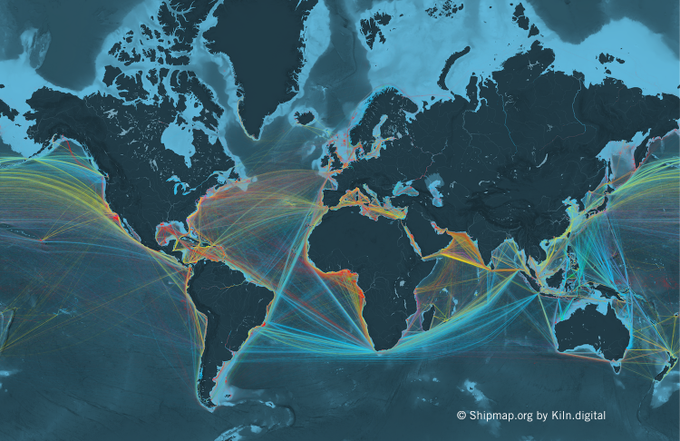
#DesignInspiration -- These are the best infographics of 2016 https://t.co/KGSzH2zGew


@SteveDininno new website is generating gr8 interest w/new collage designs, expanded stock, and new infographics.


#infographics If you think eating less is the answer - Pwaap Pwaaappp: https://t.co/3Kwh9cyjpH


The Olympics Of Olympics Graphics – @FastCoDesign https://t.co/9IrwTIinCH #infographics

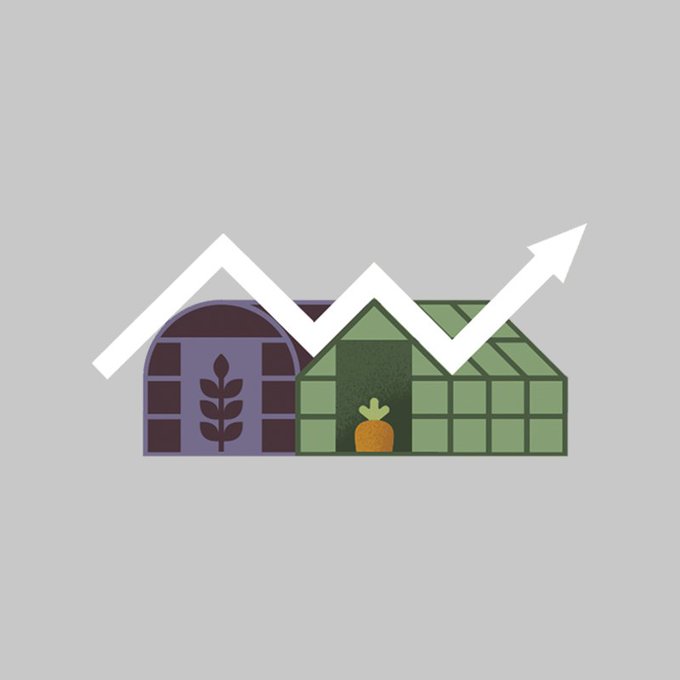
New #icondesign by @Cheung001 for @WiredUK #infographics #icons #illustration


#infographics #graphicrecording Drawing tip #3 Stay Loose. More tips on our blog: https://t.co/GDByuxwFVP


#infographics รวมอาหาร ดีต่อสุขภาพ ได้ประโยชน์ 😚 https://t.co/vQYeg69Cex #SistaCafe #HowtoPerfect #สาระ #สุขภาพ


Cute infographics featuring delicious food all around the world.
https://t.co/GBoCfgGOYe
#Infographic #Foodie #Food

Information is Beautiful recognises the best data visualisations of the year. https://t.co/uCRe2wYZfD #infographics


السلام عليكم
ملفات مفتوحة المصدر انفوجرافيك متنوعة
Business Concept Infographics
👇👇👇👇
https://t.co/2kkbk0Zm2W

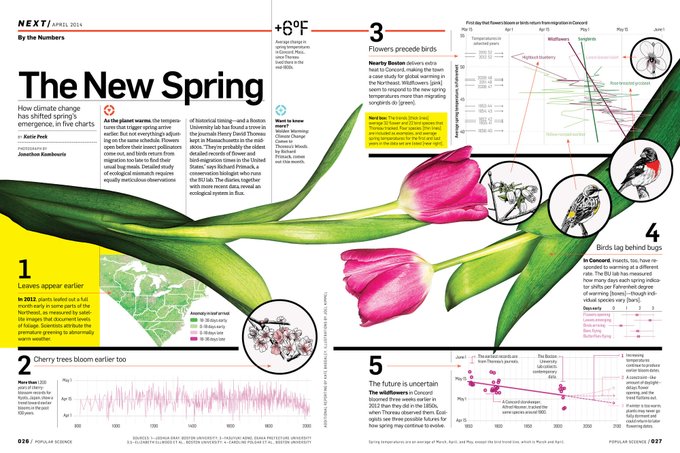
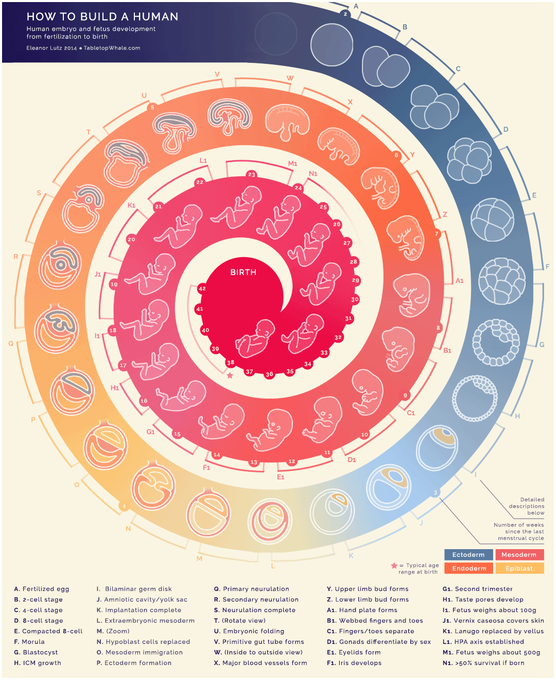
Excited to find out some of my illustrations are included in Best American Infographics. Thanks to @kathrynpeek!


Illustration for Popular Mechanics DIY project "The Electric Bucket".
#illustration #DIY #howto #infographics


#Delicious Recipes #Infographics https://t.co/Xx1cjSfdsy
via @abduzeedo & @mazakiiz


Boobs vs butts preference — Pornhub data #maps #infographics #graphicdesign


Intercampus Poll (for @Publico , @tvi , @TSFRadio ): 2015 election prefs.
Source http://t.co/y0sGWHlVIn
#infographics

The Making of an Infographic http://t.co/Qa1B2DlPQH
#LinkedIn #infographie #infographics #tips #tutorial #visual


More awesome thatn Infographics: Here’s How to Make a Bigger Impact With 'Gifographics' http://t.co/mpWxfkBXXK

Go Beyond Infographics: Here’s How to Make a Bigger Impact With 'Gifographics' http://t.co/DbiaSBHSyh