visualizationのTwitterイラスト検索結果。 850 件中 20ページ目

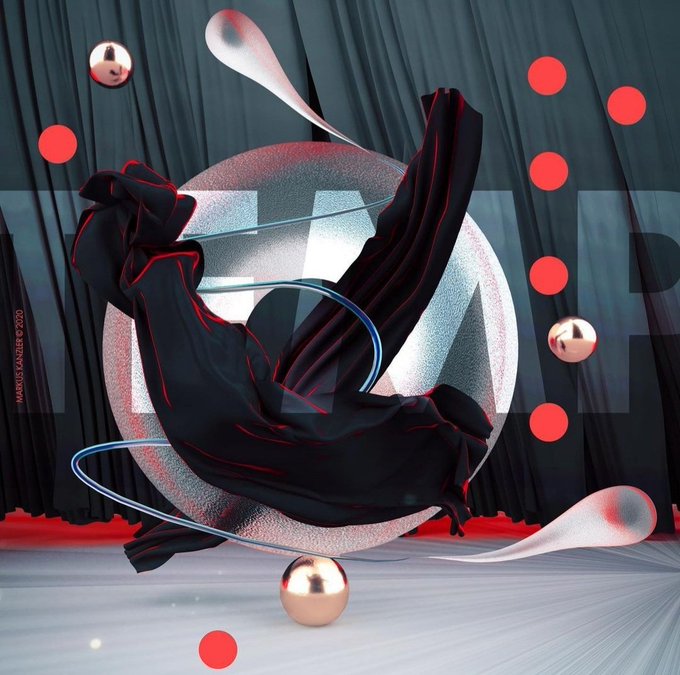


❖ Reflection - by #AtomSergal for
@sleepy_muzzle
This is a visualization of the thought process - reflection.
FA: https://t.co/83BosTcjYj
◈ Sergals © Mowamowafluff @Vilous_Official
#Vilous #Sergal #scifiart #scifi #furryartwork


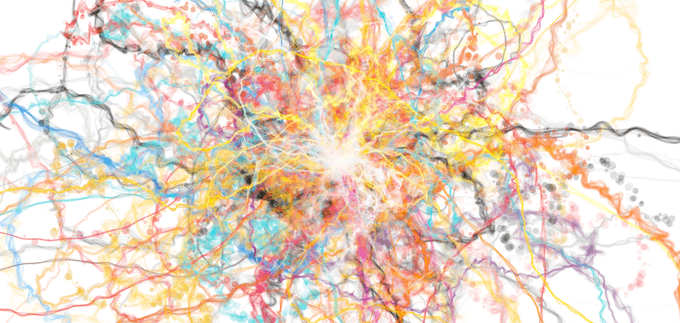
some drawings about love generated by AI (clip+vqgan).
#digitalart #digitaldrawing #generativeart #photography #aiart #nftart #NFTartist #NFTs #illustration #visualization #Romance


I'm impressed by the quality of the IPCC visualizations – most newsrooms changed very little when rebuilding them, which is always a good sign.
If you haven't seen it, I can recommend playing around with the IPCC Atlas, their great, new exploratory tool: https://t.co/kOe8ebYUyO


Here are all of the rivers and waterways in Asia (excluding Russia), coloured according to the major hydrological basins they are part of. Zoom in! This map was generated using #Matplotlib #Numpy #Geopandas.
#Python #DataScience #Data #DataVisualization #Asia #China #India.


“Alas, poor Yorick! I knew him, Horatio”. Perfectly detailed and realistic 3D visualizations by Khasan Alimbaev:
https://t.co/iq622q5V74


Want a message that will stick with your audience? Include visuals! People notice and retain visual information more easily than any other kind. https://t.co/hutgiDdfoq #visualization #visualthinking #workshops


@BrighanArt @VindrexQal *Grey Background for better visualization* 👀

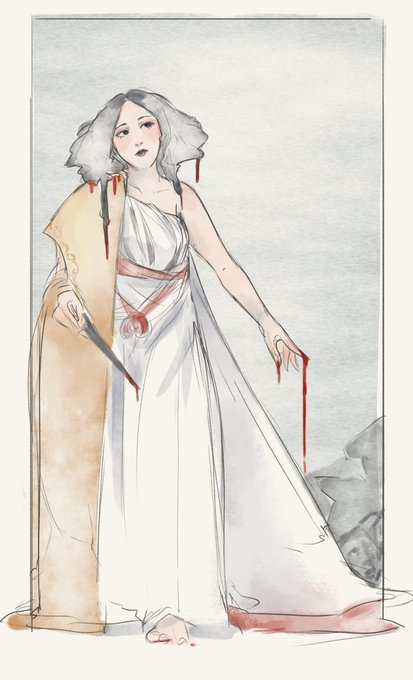
TW BLOOD and gore I think??
Anyways it's a sketch/idea of something that's like... part of her backstory, in theory. A visualization of what she's done.
I will finish it one day, but overall I'm very happy with how it looks.


visualization of what’s it like to use comics twitter


【Bスタ】DataVisualizationもくもく会 2020/08/06(金) / https://t.co/9nvGldO5dB #エンジニア #イベント #駆け出しエンジニアと繋がりたい #エンジニア初心者 #エンジニアと繋がりたい


had a vivid dream that yukata sandalphon happened so here's a visualization of my worst nightmare

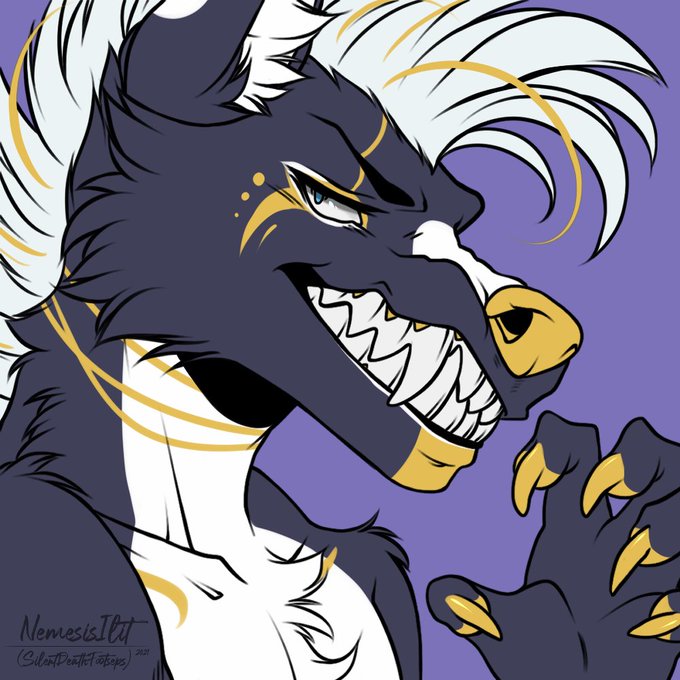


For better visualization; Here are the three "Toothy Icons" I've done! Again, these three characters belong to my partner @ChemicalRain8 / @QuantenZiel ~
(Please do NOT take/use them!)
Feeling excited to draw more characters like this very soon.
Rts are always appreciated 🖤

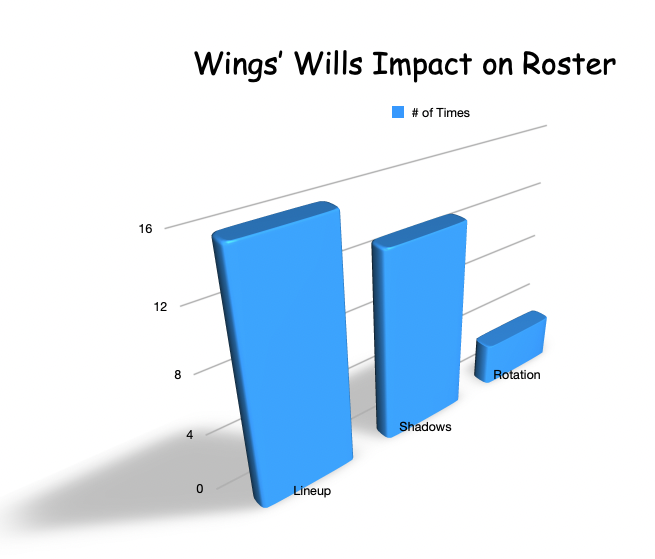

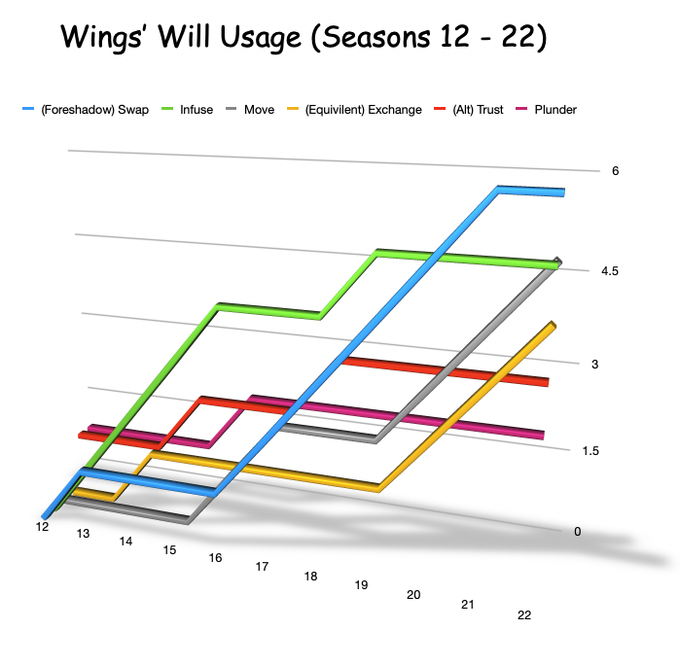
Helping clients draft their wills is our job, but Data Visualization is our passion.


15th project: @NadiehBremer's take on Nature, "Marble Butterflies". "I've always loved generative art and this topic seemed like a perfect opportunity to give it a try."
Find the visualization here: https://t.co/JVRUkUO38b and read about the process in the Data Sketches book.


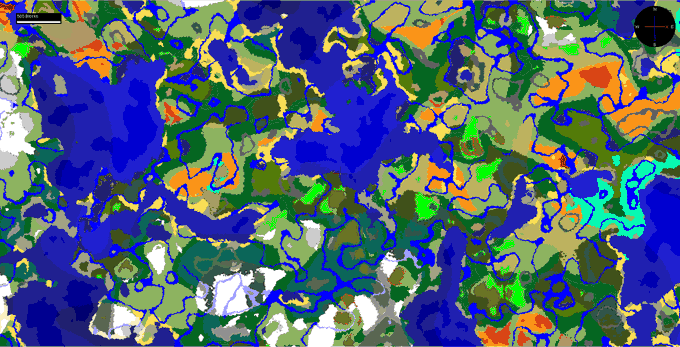
Here is a visualization of the biome tweaks, left is snapshot 1 and right is snapshot 2, both at y level 100. This map is on seed "test1" centered on 7855628 100 7798212.


Medieval themed visualizations for a childrens' nonfiction book! (also did similar work for a museum but can't show it yet...)