visualizationのTwitterイラスト検索結果。 850 件中 34ページ目


a quick visualization of a new OC 👀 Meet Conrat (said like Conrad) the bat..rat.. guy.....
#furryfandom #Anthro


@ProcessingOrg @p5xjs We're using Processing extensively @creativeinquiry for data husbandry and visualization in our research collaboration with @cmoa's Teenie Harris Archive. These screenshots show annotation layers computed by many different API's (Goog, FB, Msft, dlib), unified in Processing.

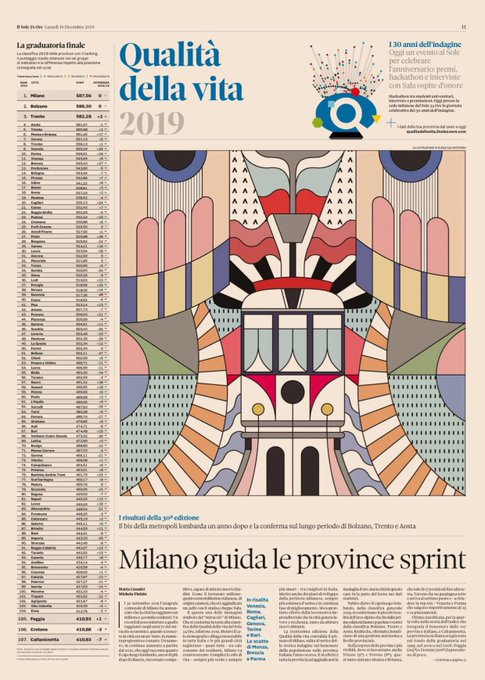


90 indicatori e 30 anni di dati. Torna la classifica di #Qualitàdellavita 2019 del @sole24ore, l’indagine che fotografa il benessere nelle province italiane.
Su carta e web, un lavoro #DataDriven con #Datavisualization top https://t.co/PLOwepeB1s


If you're curious about the imageboards: they were all drawn by Miki Takeshita after the scenario was written as the first visualization of this work, before any storyboarding. Easy to tell they played an important role defining not just the Hoshiai's mood but even body language


I haven't progressed past the 5th gym in #PokemonSword in over 2 weeks because apparently Sneasel is shiny locked or something. Here's a visualization of this whole ordeal.


Have you tried using Mol*, the new #3D molecular viewer developed by @PDBeurope, @rcsbPDB, @buildmodels, and @CEITEC_Brno? Mol allows fast visualization of molecular structures and corresponding data all within the browser window! #SciArt https://t.co/gFCmyX8BXf


Hey all! I've created an article/data visualization on the appearances of X-Men over the past 56 years, inspired by the recent design work of @hellomuller and @JHickman. I hope you all enjoy! https://t.co/VYRh1hGIRI
#xmen #datavisualization #ineedajob


This purchase includes a bundle of three of LIGHTARCHITECT's top add-ons for Blender! Included in this pack are Khaos, Cablecam and Filmmaking Pre-visualization add-on to streamline your Blender 3d creative desires! https://t.co/DMgzsDMmP0


@BrendanLorLowry @S2BlueTeam @Dark_Reign12 @SithVenator Ok I’ve dug out the character visualization artworks by Ilya. CLEARLY he’s 100% capable of drawing Motoko as a mature woman. But the final design in the poster is entirely different. I don’t know what had happened during the process but this art direction is rather concerning.


Anyways for male and female byleth im going with the neutral visualization concept. Listen to their mix tape


For the #monthoffear "Monsters Within" theme - a visualization of living with mental illness.
Graphite, 7"x6".
Will put this and few other pencil pieces up for sale in a bit.


If you’re a fan of #IT & #ITChapter2 GO PICK UP THE WORLD OF IT BOOK! It includes all the art I’ve shown plus the true genius of all Andy’s visualization for BOTH films through his sketches & storyboards of his & others, character bios, behind the scenes, concept art & MUCH MORE!


My first #PortfolioDay 🌟
Hi, I'm Will 👋 I'm a creative developer focusing on data visualization, information design, and generative art.


At @medstockimages we’re visualizing medicine into illustrations and stock images that are available for both personal and commercial use! Check out the Catheter ablation visualization #EPeeps #FOAMed #MedEd #Cardiology #ACCFIT #medillustrations #GraphicDesign #medicine


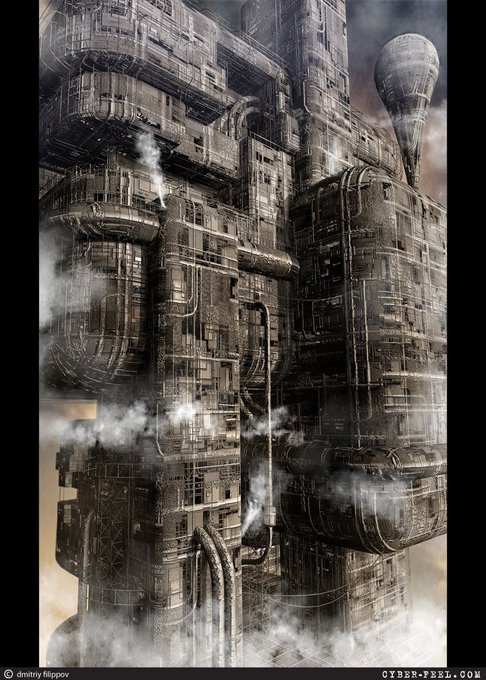
#Steampunk art, 3D visualization and hand made work by Dmitriy Filippov
https://t.co/M6CGdGxxyI


#Steampunk art, 3D visualization and hand made work by Dmitriy Filippov
https://t.co/M6CGdGxxyI


WIP Render with Lumion 9.5 pro
Models from evermotion used hdr lightning more coming soon
https://t.co/wz0g55z2fP
#lumion #lumionpro #lumion9 #lumion9pro #render #visualization #realism #archviz #modern #luxury @lumion3d @LumionUK

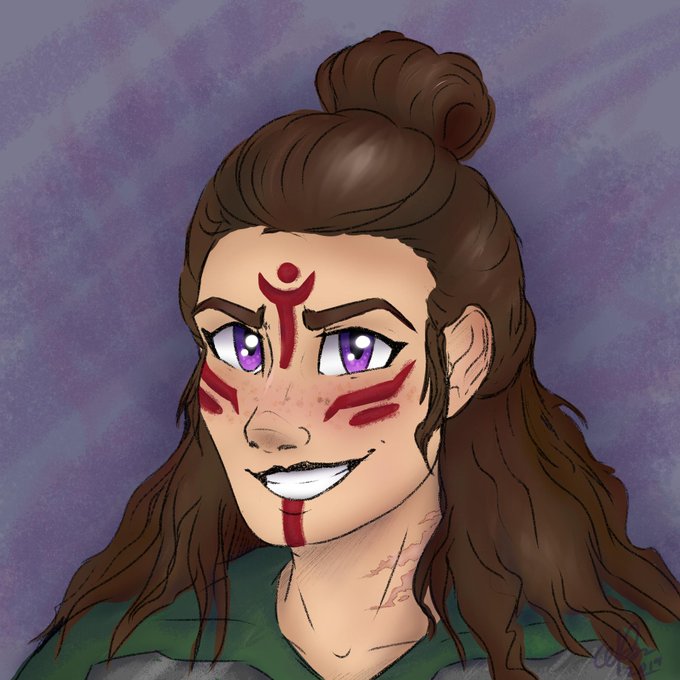
Here's the first visualization of my lovely barbarian character, Morgana O'Dwyer!!! Love this buff Irish lady <3
#digitalart #sketch #DnD