visualizationのTwitterイラスト検索結果。 850 件中 37ページ目

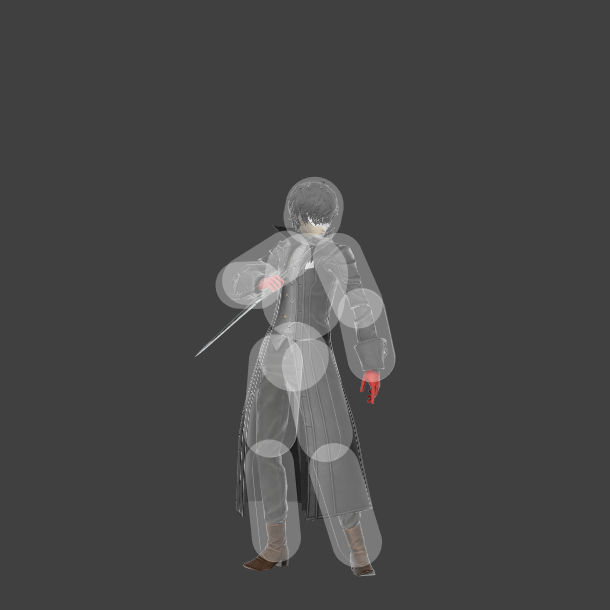


ジョーカーのやられ判定
全キャラの画像は一覧はドライブから
Joker hurtbox visualization
All pictures can be found in Google Drive
https://t.co/RnUQf5YAH6


After the visualization of black holes, I was too excited to sleep last night.


The 25 Best Data Visualizations of 2018
- I wonder what amazing #dataviz examples we will see at the end of this year!
https://t.co/hiDXco5im6
@marketcafemag #visualization #DataScience


A probably visualization of that mccree icon. Idk how that hat works. He also just ends up looking like Matt


What do you think of this totally different visualization of #SnowWhite, from a pulpy 1970s retelling of the fairy tale? #vintage #picturebook #folklorethursday #fairytales #dwarves #vintagechildrensbooks


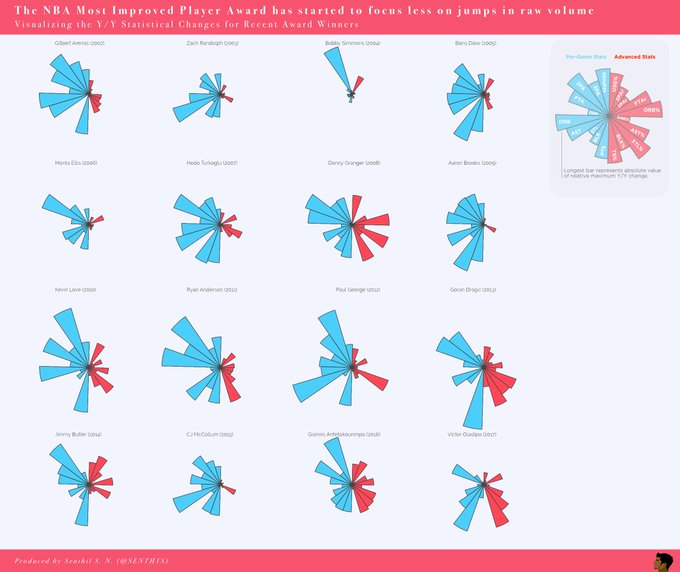
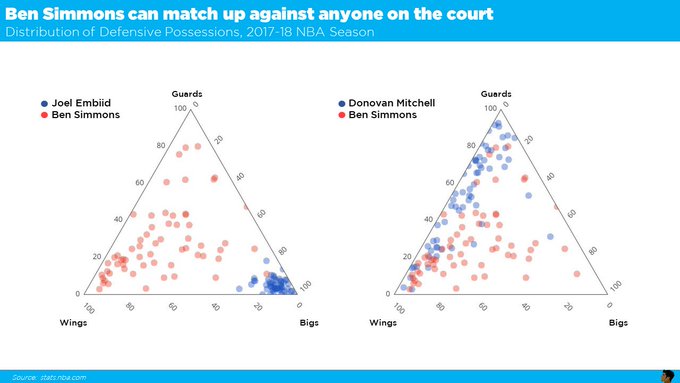
Meet #DataVizSociety member Senthil Natarajan (@SENTH1S), who combines data analytics and data science with visual communication across sports, startups and Fortune 500 companies. #sportsviz #Datavisualization

Another visualization of #Cinderella, this one by #MargaretEvansPrice from 1921, in Once Upon a Time. #Illustration #WomenIllustrators #GoldenAgeIllustration #Fairytales #Folklore #folklorethursday


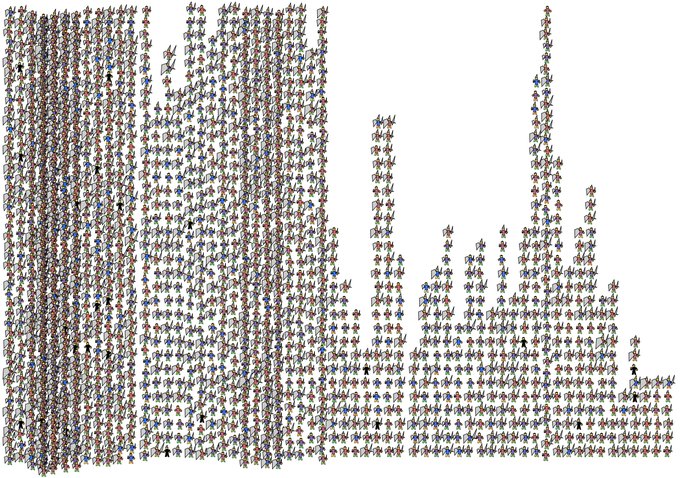

My #datavizsociety challenge entry: 3500 members of @DataVizSociety represented as Chernoff Adventurers:
Data skill = shield size, Visualization skill = sword, Society skill = hat, latitude = pants color, longitude = shirt. Stacked by hour they joined.
Ended up 10,000 pixels wide


WELCOME Kristen Humphrey to #AstoundUS!! Kristen is from Southeastern Texas and studied Visualization at Texas A&M University! Check out more of her brilliantly textured animal illustrations on our BLOG! https://t.co/NNxZMZpWDI #IllustrationAgency #AstoundingNews @ITSME_RECRUIT


Meet #DataVizSociety member Guillermina Sutter Schneider (@gsutters), an Argie 🇦🇷 Data Science student based in Washington, DC! She co-authored a dataviz stylebook you can find at https://t.co/2ESA61DmCM and is passionate about best practices & terminology in #datavisualization.


La Visualización de Datos es el resultado de la combinación de Tecnología, Ciencia y Arte para conseguir contar una historia basada en datos fiables y contrastados. #visualthinking #visualnotes #datavisualization #visualizaciondedatos


The Data Visualization Society (@DataVizSociety) now has 3515 members. Here's my latest @tableaupublic viz on what they look like https://t.co/iSkhiWXxxp - if you want a great tool-agnostic gathering of fellow dataviz fans and professionals, sign up now!


Here an example for a “creative” #sketchnote. It’s the invitation for my birthday party of this year. I pixeled day and location because I dont want to offer an official FB-Party. 🤪 #todaydoodle #sketches #visualization #creativevisuals


Some details from my #dataviz for @sciencefocus: the #periodictable and the elements under threat. https://t.co/G2K6HwT06H The full printed #infographic will be on BBC Science Focus March issue! #Datavisualization


Lowpoly people colorful low-poly 3D model ready for Virtual Reality, Augmented Reality, games and other real-time apps. This pack contains 167 lowpoly human models, ready for CG visualization. 1200-1600 polygons per model. https://t.co/0UWrqst2dr


A portrait of our 1700 current members (badges based on your responses designed by Data Visualization Society founding member @AmyCesal). #datavisualization #datavisualizationsociety


We're excited for day 2 @PI_Apparel LA! If you curious about 3D product visualization, stop by to see how fast KeyShot can deliver incredible images and animations!
Images rendered in KeyShot 8 by Will Gibbons #PIApparel #3D #apparel #footwear #softgoods #3drendering