DataVizSocietyのTwitterイラスト検索結果。 8 件


Ever wonder what the various #dataviz tools look like as people? And need stickers of them? Check out #datavizsociety member @eolay13’s shop!
https://t.co/cmY1bm907J

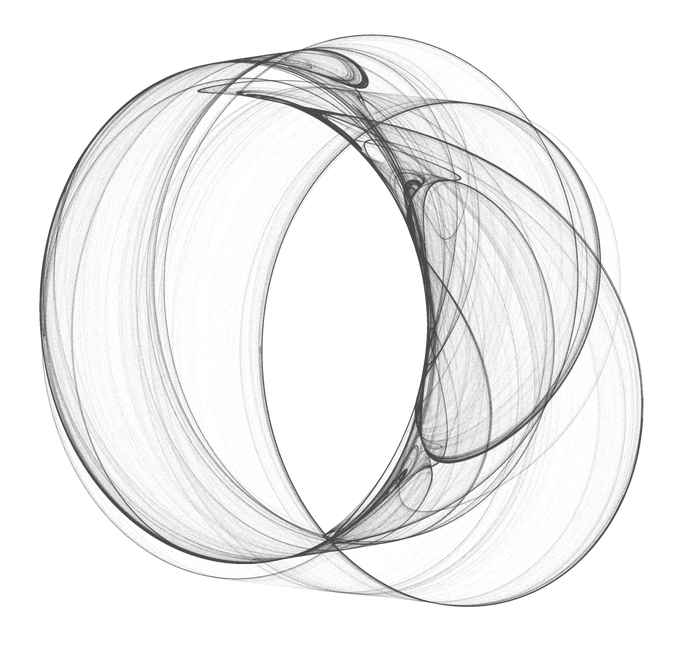


Meet #DataVizSociety member Will Chase (@W_R_Chase), data scientist at Upenn researching epidemiology of tuberculosis in Africa, focusing on dataviz. He works mostly in #rstats & is currently learning #D3js. In his spare time he also makes generative art.
https://t.co/mJYTKJL7dv


Hey #datavizsociety members check your emails for this special #Easter gift: data-driven eggs! Thanks to @martintelefont for the inspiration. #datavisualization


Meet #DataVizSociety member @yuliakrolik, an information designer and data scientist, working with long time collaborator @o1sound on dataviz, sciart and projection mapping projects as @pixelsandplans. She helps moderate the Best Practices, Data Art and Mapping channels.


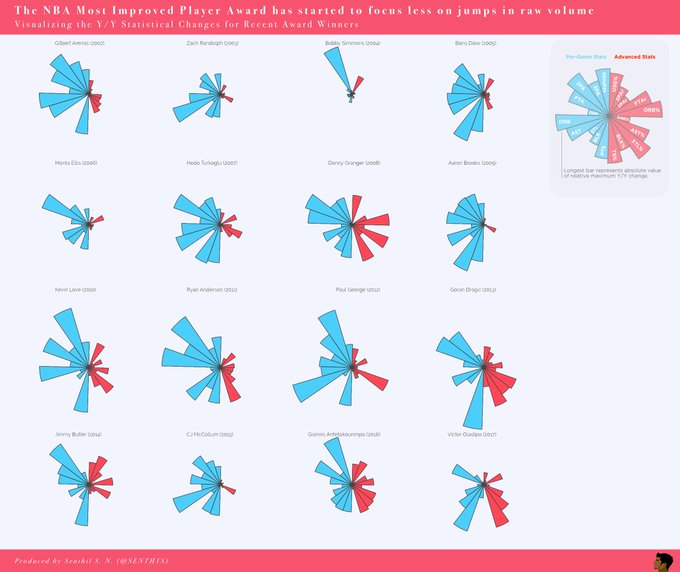
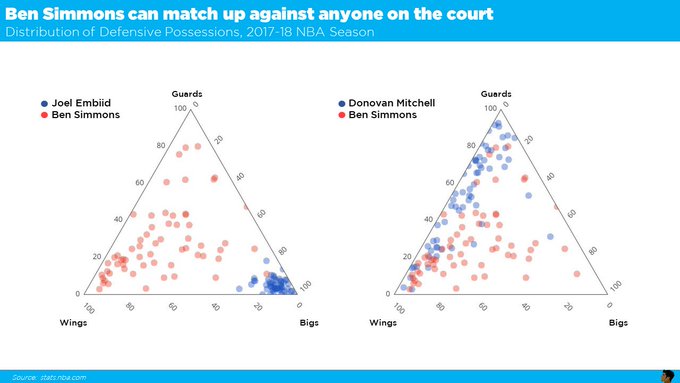
Meet #DataVizSociety member Senthil Natarajan (@SENTH1S), who combines data analytics and data science with visual communication across sports, startups and Fortune 500 companies. #sportsviz #Datavisualization


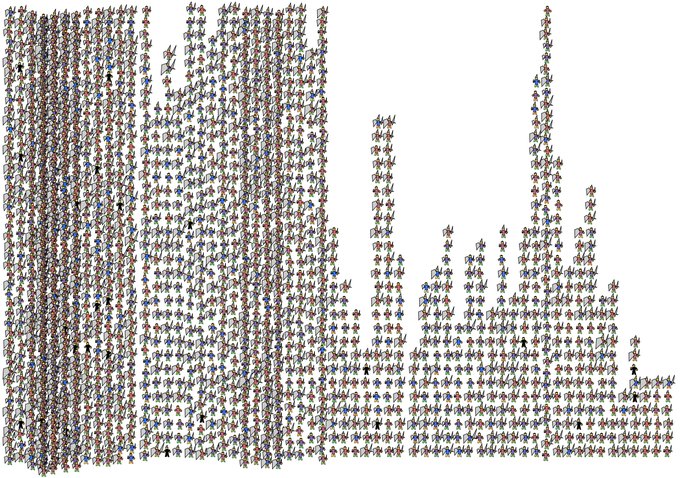

My #datavizsociety challenge entry: 3500 members of @DataVizSociety represented as Chernoff Adventurers:
Data skill = shield size, Visualization skill = sword, Society skill = hat, latitude = pants color, longitude = shirt. Stacked by hour they joined.
Ended up 10,000 pixels wide


Meet #DataVizSociety member Lilach Manheim (@lilachmanheim), lead analytics engineer at Pluralsight, with a background in art history & HCI. She's a #Tableau zen master & occasional writer on data literacy, UX & art at https://t.co/H1FWNoCCEm and interested in text analytics.


Meet #DataVizSociety member Guillermina Sutter Schneider (@gsutters), an Argie 🇦🇷 Data Science student based in Washington, DC! She co-authored a dataviz stylebook you can find at https://t.co/2ESA61DmCM and is passionate about best practices & terminology in #datavisualization.