visualizationのTwitterイラスト検索結果。 850 件中 38ページ目


this is the perfect visualization of Jim Davis' god status, and how he is powerful enough to smite you at any second


I love avatar generators! They make character visualization easy. ㅠㅠ
Meet my son, his name is Cylria Hughes. :)
https://t.co/T9CwIJjkvo #Picrew #彼氏メーカー


Future of Medicine, what can it look like? Which Tools will we be using? #scicomm #futureofmedicine #3Dprinting #VirtualReality #visualization


Human rights violation and protection by country: a detail from my new #dataviz for @La_Lettura, out this week. #Datavisualization #ddj #Infographics


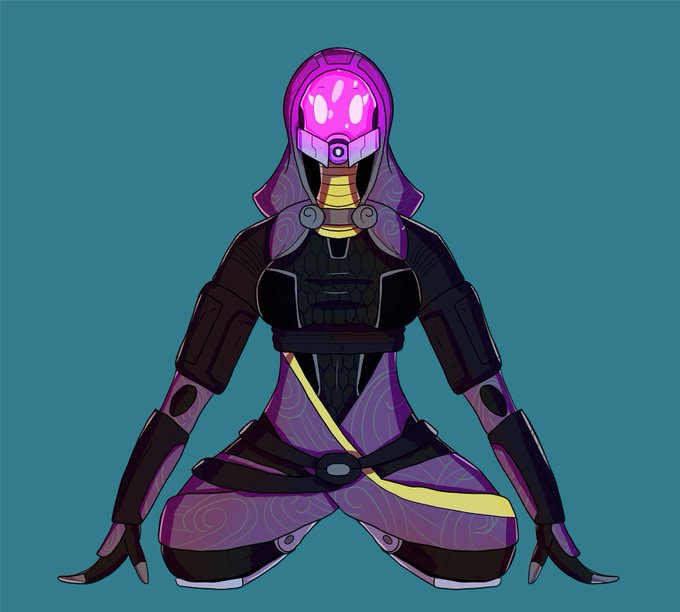
@Listrial_ Visualization major. I do a lot of original and fan art


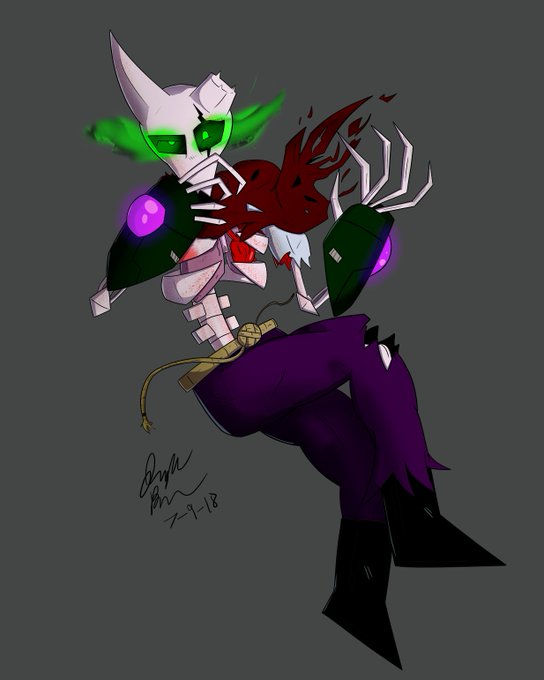


#PortfolioDay Names Joseph Brown, currently a student at Texas A&M in the Visualization Department. Hope to be a character designer, story artist, or a basic animator. Oh and the portfolio is still a work in progress :)
Portfolio: https://t.co/oOOfixBFfB

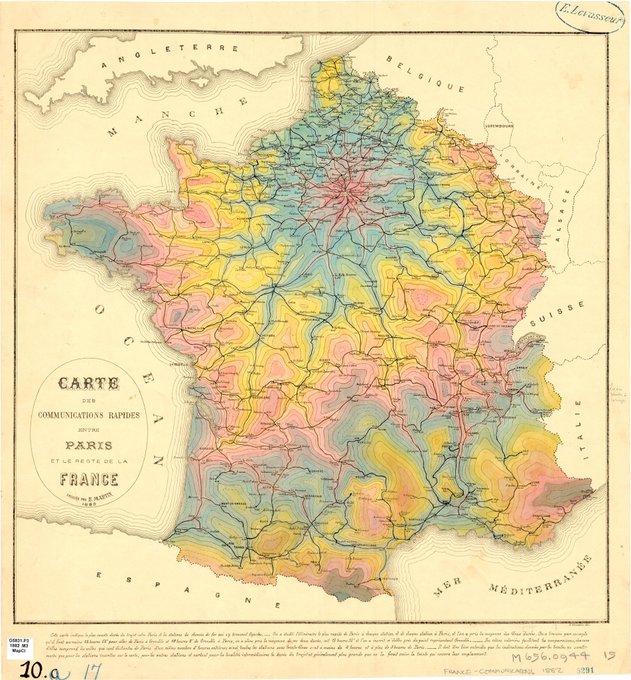
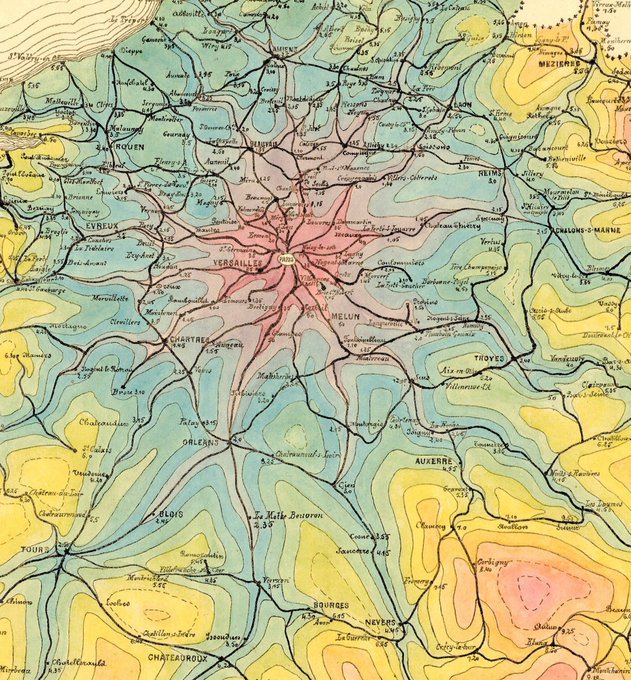
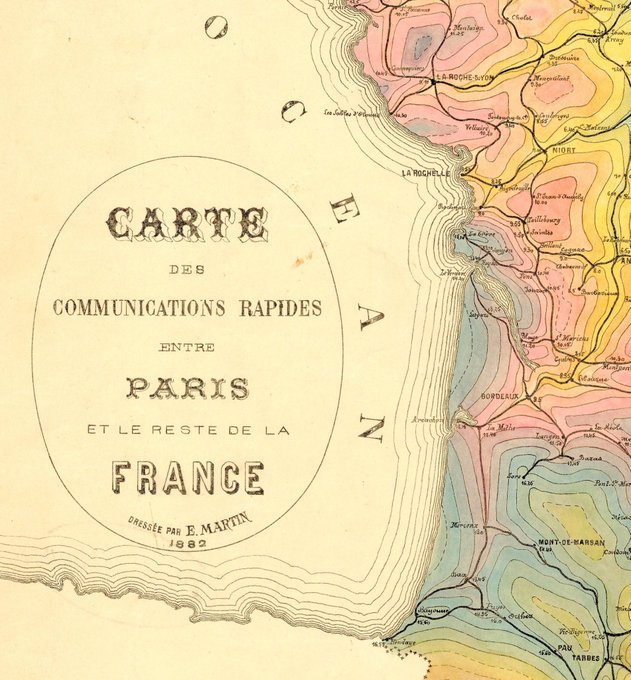
This is my new favorite French #map. Found this one in the University of Chicago map collection. The color choices are not what I expected from a #datavisualization made in 1882, but I'm here for it. This shows the travel times from Paris radiating out into the country.


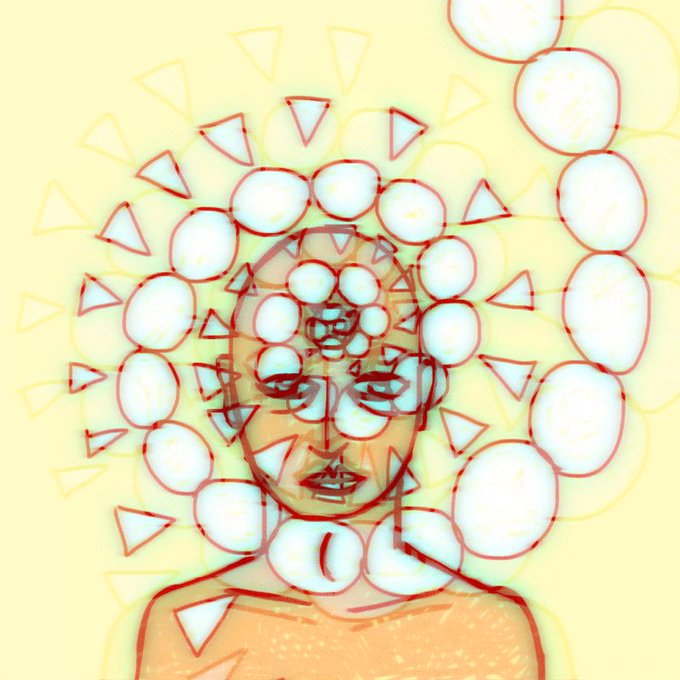
Did a visualization where I walked through a forest that slowly overgrown with mushrooms. The spores and the slow gradual change was to make my mind more empty.
Made a photobash of various pics I took to get this
#hypnosis #hypnoticvisual #trance

#Dataviz narrative layers and #illustrations for The Map of Remote and Literary Islands: https://t.co/pMpo3cJhgD #infographics #datavisualization @La_Lettura


My new #dataviz for @La_Lettura is a visual exploration of the world of #MaryPoppins (and it's full of umbrellas! ✨☂️) #datavisualization #infographics


Guess I've been seeing this going around so why not join in on it. Hi my name is Joseph Brown, I am currently a student at Texas A&M majoring in Visualization. Favorite thing to do is draw characters and animate, hope to make a show one day.
#ArtistOnTwitter #student


Congratulations to the 2018 #Vizzies SCIENCE VISUALIZATION challenge winners! Check them out: https://t.co/U06TyEPkBe #BioArt #ArtScience


Dhampir race concepts and visualization. Part of my dark fantasy universe Driftwood Archives. Kickstarter for the first artbook going live the first of November... more info at https://t.co/2PZTkNwkcd, link in the bio! .
.
.
#photoshop #painting #conce… https://t.co/PJgSTa27OY

Ha’dari concepts and visualization. Winged humanoid race... a part of my dark fantasy universe Driftwood Archives. Kickstarter for the first artbook going live the first of November... more info at https://t.co/2PZTkNwkcd, link in the bio! . .
.
#photo… https://t.co/gO4gcb1Q4W