visualizationのTwitterイラスト検索結果。 850 件中 39ページ目

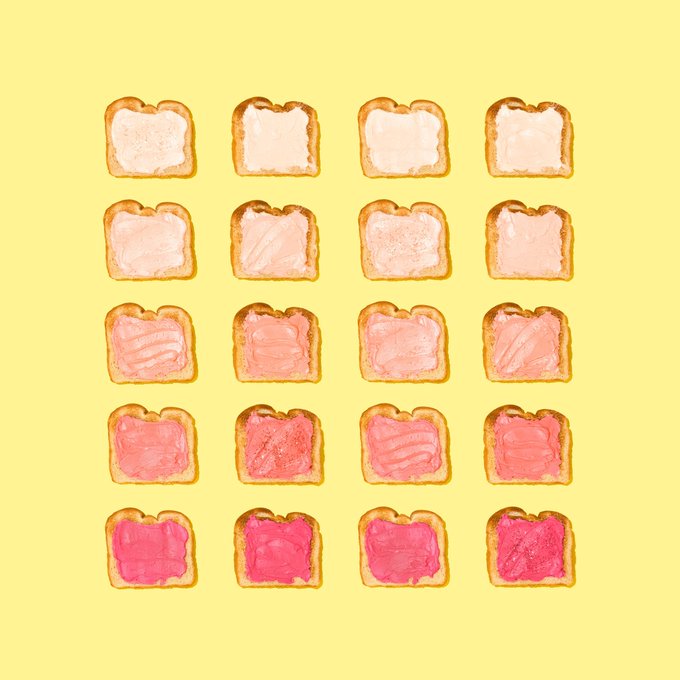
Start your morning off right- with toast! @tomwujec shows us how. https://t.co/MXx5cvyXY2 Photo by @amy_shamblen on Unsplash #Systems #drawtothink #visualization #designthinking #vizlit #vizlitforall


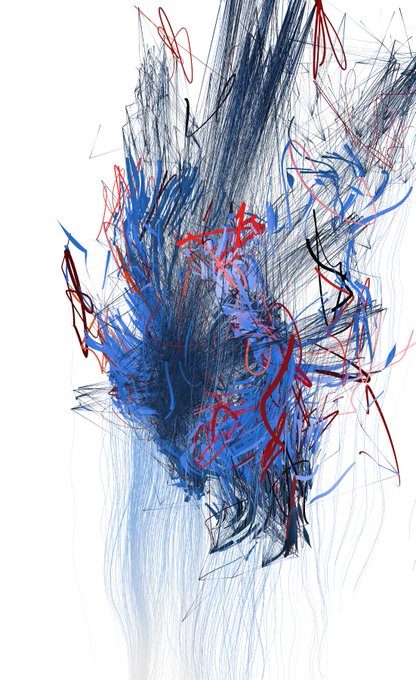
Fomorian (giant) concepts and visualization.
Part of the dark fantasy universe of Driftwood Archives. Kickstarter going live the first of November... more info at https://t.co/2PZTkNwkcd, link in the bio! .
.
.
#photoshop #painting #conceptart #fantas… https://t.co/hcs4hRv33m

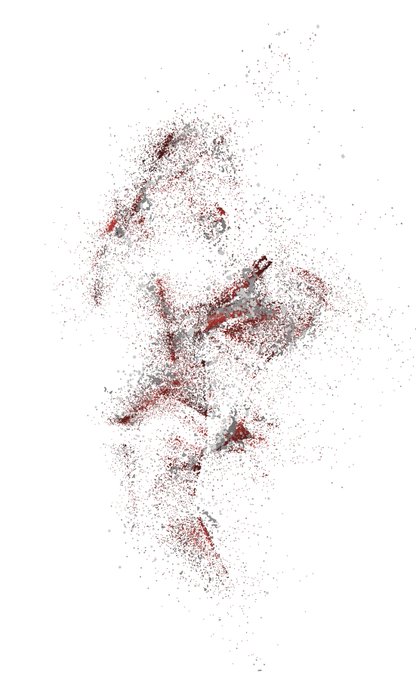
Orc concepts and visualization.
Part of the dark fantasy universe of Driftwood Archives. Kickstarter going live the first of November... more info at https://t.co/2PZTkNwkcd, link in the bio! .
.
.
#photoshop #painting #conceptart #fantasyart #illustr… https://t.co/9X9vmz2TEh


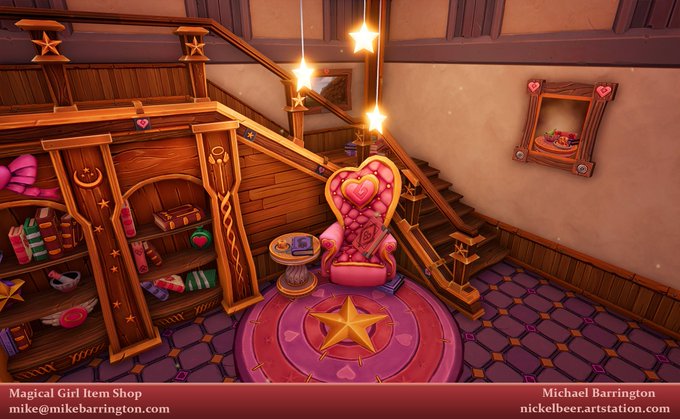


Hello #portfolioday. I'm Michael. I've been working on game art in serious games and visualizations for 8 years. I really love stylized and hand painted artwork.
https://t.co/09s6Zb7Hzn
#gameart #art


Cropped version Walter Knoll living visualization created and render in Unreal Engine 4
https://t.co/WKsI4yMQDB
#unreal #unrealengine #ue4 #composition #archviz #3d #datasmith #living #visualization #substance @UnrealEngine @Allegorithmic @ChaosGroup


RELEASE: Unwelcome Gaze – a network visualization of Google, Facebook, and Amazon. https://t.co/rPGuhB841J


People depicted in the Welsh Portrait Collection with 4 or more portraits. Ordered by total number of portraits. A visualization powered by #Wikidata. @NLWArchives @NLWGraphic


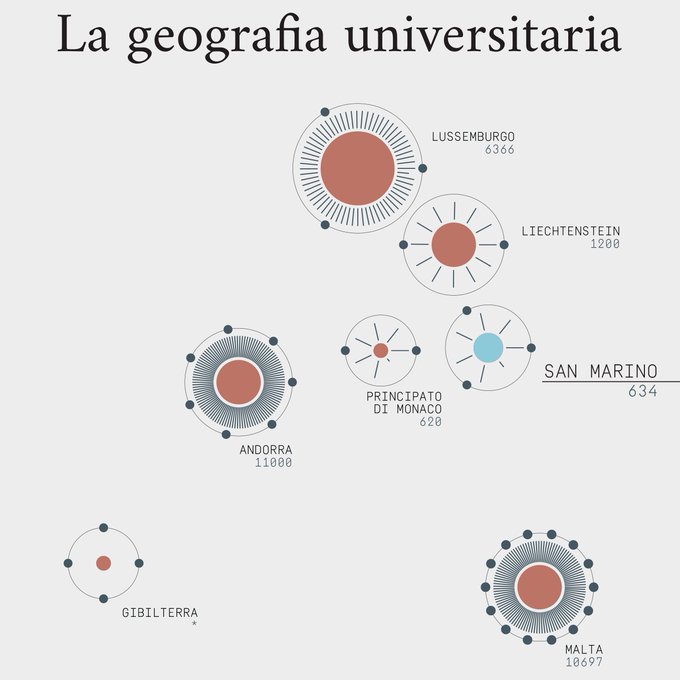


Amazed by our #dataviz workshop students' projects! Working with them was such a pleasure, we had a great week at @unirsmdesign! @francesco_majno #infographics #datavisualization


Gio.js: Three.js 3D Globe Data Visualization Library - https://t.co/fvY9W91KxR


New Project: Flights to Rome #flights2rome. A data visualization of the entire global 🚗 and ✈️ mobility network.
→ https://t.co/c5pYhfHD7q
w/ @st_phan @moovelLab @HerwigScherabon @whatsuprapha @tibbb Data: @flightradar24 and #OpenStreetMap


Public voting is now open for the 2018 #Vizzies! View and vote for your favorite science and engineering visualizations right here: https://t.co/iSCeTGoWWV


And on this #FabulousFriday am doing some visualization! #thingstodowithtwistedankle #artofmelush #visionboard #mindtravel


FYI - here’s the visualization I put together at the @giorgialupi and @stefpos’s #eyeo2018 session

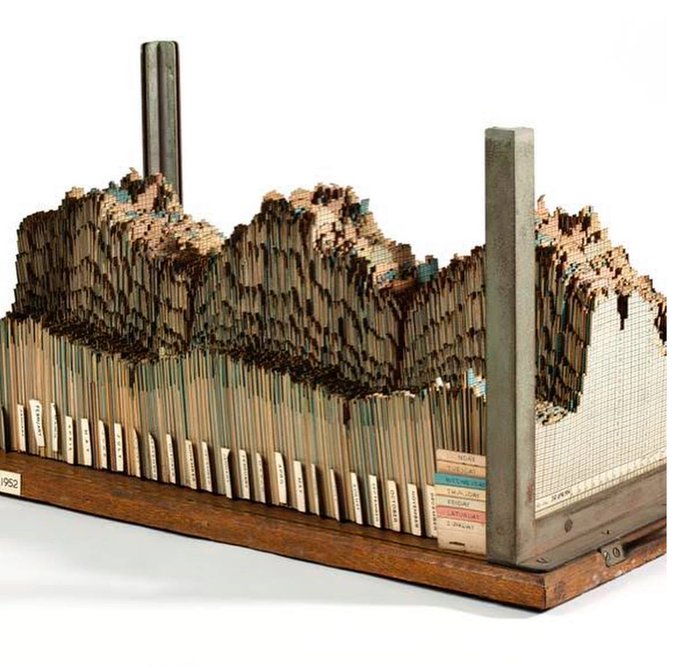
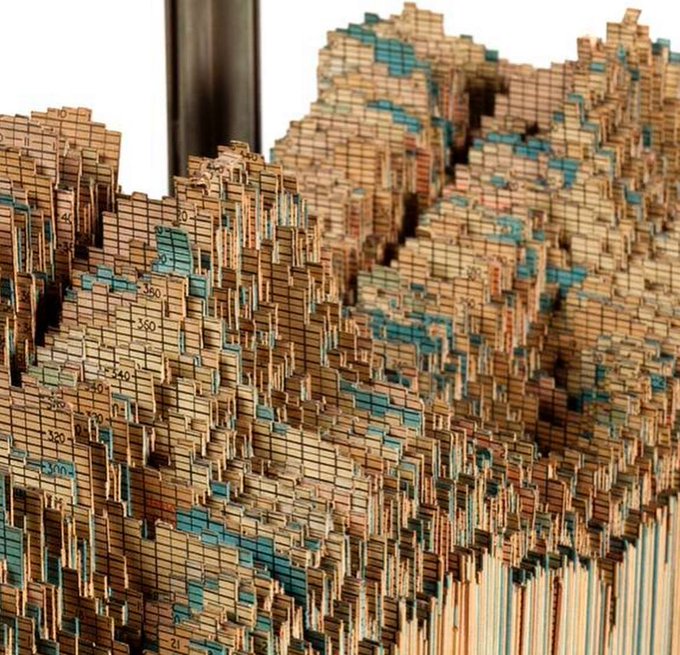


An early example of 3D data #visualization representing electricity generation and demand over time. by Central Electricity Generating Board planners, c.1954 (representing data from October 1951 to April 1954)
From the @sciencemuseum https://t.co/Yrh0VoR7rf


This June I'm running a new Visual Narratives Workshop, at Columbia University. If you know of any students/faculty who may be interested in applying please forward this to them: https://t.co/UpC9vHPDGa
#visualization #storytelling


Take a look at our report on CryptoKitties (@CryptoKitties) a purrfectly artful visualization of the #ethereum blockchain in action. These fuzzballs are more than just digital Beanie Babies, they're gamifying the web as we know it - https://t.co/OitF8jAiiX #crypto #blockchain


Awesome work by Fiero Animals with @Adsk3dsMax, @CoronaRenderer and @hdrlightstudio.
Credits
Client: Mazda
Agency: JWT
Art-direction: Eugene Sidelnikov, Nikolay Kvartnikov
3D visualization: Anton Bessonov
Retouching: Pereskokov Sergey, Nikolay Kvartnikov