visualizationのTwitterイラスト検索結果。 865 件中 43ページ目
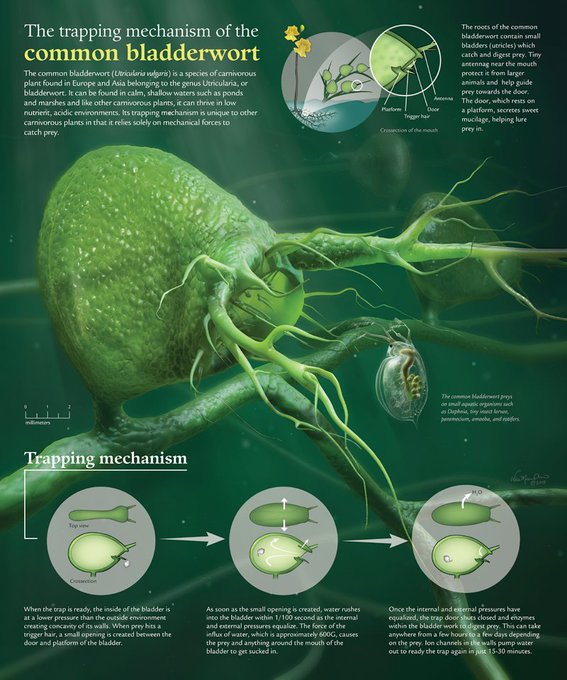
Congratulations to the 2016 #Vizzies SCIENCE VISUALIZATION winners! See them:https://t.co/arbRRhLuUA #SciArt #BioArt
Network analysis and visualization with #rstats & igraph: #NetScix16 tutorial https://t.co/nlH1RO2Fm6 #dataviz #sna
Skip science class? Here are 7 science visualizations that will make you smarter. https://t.co/3Kc7AMIo6I
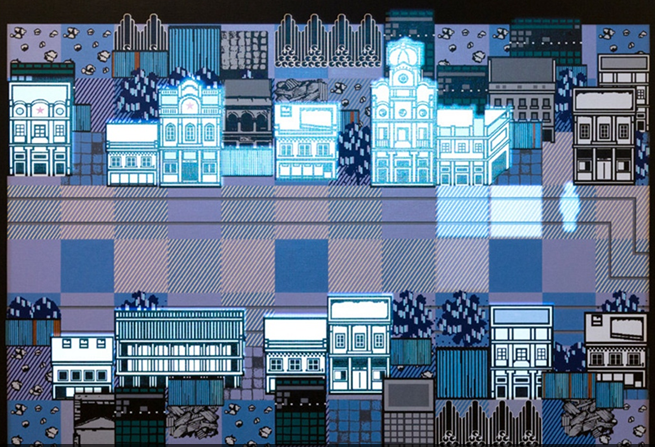
“Scratchable Latex – the Precise Visualization” Opened at Shanghai Mingyuan Art Museum
https://t.co/mnQNdh6Ecq
Skip science class? Here are 7 science visualizations that will make you smarter. https://t.co/3Kc7AMIo6I
Skip science class? Here are 7 science visualizations that will make you smarter. https://t.co/3Kc7AMIo6I
Skip science class? Here are 7 science visualizations that will make you smarter. https://t.co/3Kc7AMIo6I
Python Visualization Libraries List https://t.co/2vJeF0b0hL
A Beautiful Visualization of More Than 500 Representations of Exoplanets https://t.co/WiWVKM2Ohd
New Visualization Shows Incredible Variety of Extraterrestrial Worlds https://t.co/epOzRy2uB7
Python Visualization Libraries List
http://t.co/2vJeF0b0hL
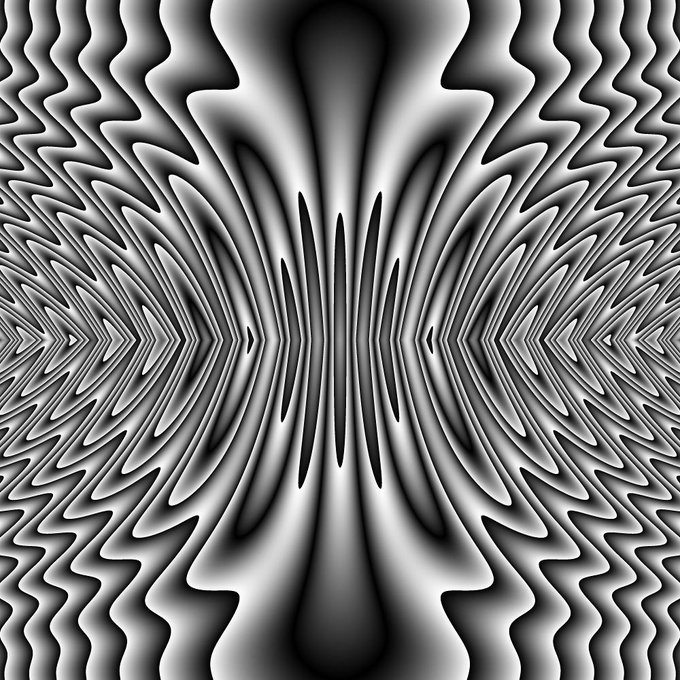
New Post: Visualization of a Function Through Time http://t.co/Dx39TT8vaQ #mathart #whatgoodisthisfor?
SCIENCE VISualizations for the 2016 #VIZZIES – due next week! Submit by 9/15 http://t.co/yxTYUrB43K #SciArt #BioArt
STUART BRIERS ILLUSTRATION: VISUALIZATION
http://t.co/f5GdaJsJwK
#illustration @RappArt
How to create an awesome data visualization http://t.co/FRd4ynhG5h via @danielzeevi on @DashBurst #Dashburst #Design
A Proportional Visualization of the World’s Most Popular Languages http://t.co/kfQNjWPm6b
CALL for SCIENCE VISualizations, #SciArt, #BioArt for the 2016 #VIZZIES!! http://t.co/yxTYUrjsFa by 9/15 @NSF @PopSci
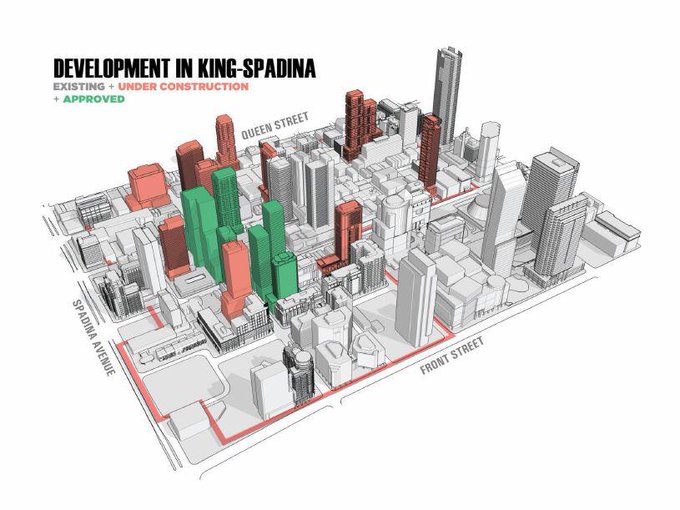
Fascinating @CityPlanTO visualization. Dev in King-Spadina:
- existing
- under construction
- approved
- proposed


