30DayMapChallengeのTwitterイラスト検索結果。 91 件中 5ページ目


#30DayMapChallenge 8. Green
3D landscape from height map and satellite image of the Ijen volcano, which has a one-kilometre-wide green coloured acidic crater lake.
Done with #blender using height map from https://t.co/Mbsrscekqh and satellite image from https://t.co/3RWxNXHASk

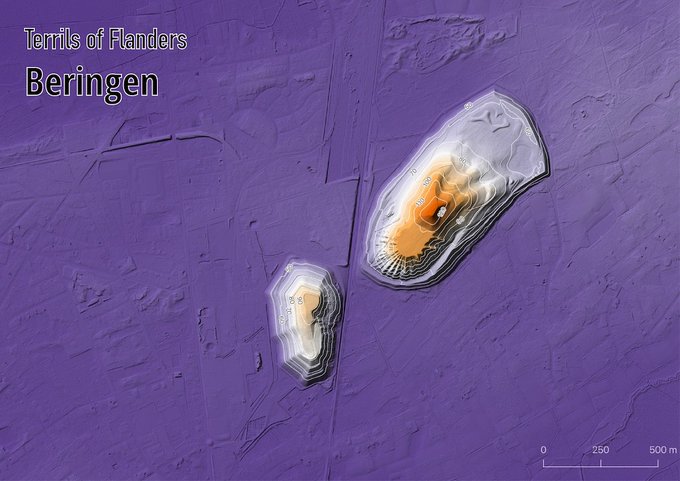


@f_l_o_u_r_i_s_h @Stad_Antwerpen @hnshck #30DayMapChallenge nr 11 (elevation): The Terrils of Flanders (that's how we call spoil tips or slag heaps here)
Very pleased with these ones

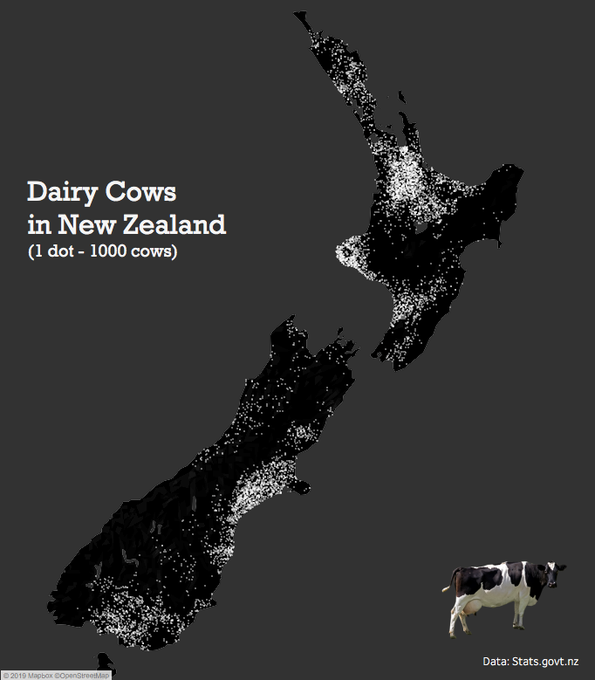
#30DayMapChallenge Day10: black & white. A simple dot density map (first one for me) of dairy cows in NZ (which are sometimes b&w:). Made with st_sample() from {sf} package #rstats, visualized in #Tableau.

@f_l_o_u_r_i_s_h @Stad_Antwerpen #30DayMapChallenge nr 9 (yellow): a yellow map of the Belgian municipality of Geel, which means "yellow" in Dutch 😎 https://t.co/tJ6U6ODxI7


briefly joining the #30DayMapChallenge party on a friday night 😊. been playing with 3D, overlayed colormaps for visualizing GFS cloud cover data.


¿Cuántas personas con VIH reciben tratamiento? En mi #30DayMapChallenge de hoy les traigo este interesante dato. En 2018, a nivel mundial 37.9m de personas viven con VIH, 23.3m reciben tratamiento, 62% toman retrovirales.
México está sobre la media, 70% recibe tratamiento.
Adeus


#30DayMapChallenge 4. Hexagons
Short on time, so it's a lazy one: Archaeological sites in China during the Neolithic
Data source: https://t.co/nIW66s5coH

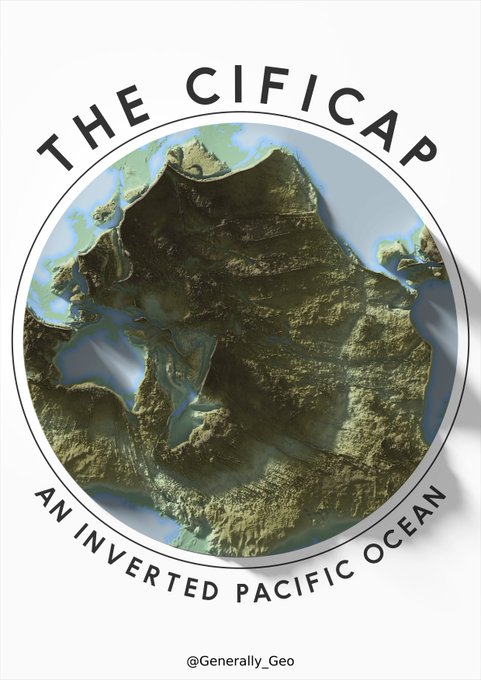
#30DayMapChallenge Day 5: Raster
inverted dem using CleanTopo2, @pinakographos blender tutorial and a whole lot of open source software


#30DayMapChallenge 🗺️
Day 4: hexagons
Total annual loss of bee colonies per US state 🇺🇸
🐝🐝🐝
Data source: https://t.co/PoQirOKj4y
Tools: #rstats #rspatial #ggplot2 📈
@beeinformedinfo #bees #map #hexagons


#30DayMapChallenge 2. Lines
Designated routes for bicycles #Brussels vs. #Amsterdam
source: @openstreetmap
rendering: #keplergl

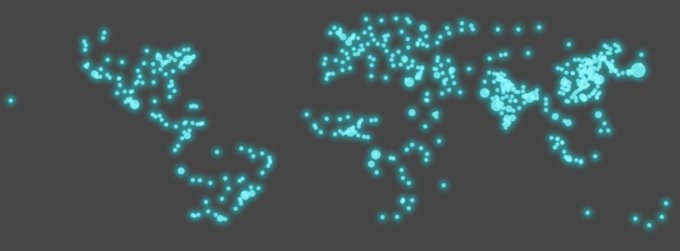
#30DayMapChallenge. Day 1-st
Biggest urban areas in the world in 2050