sentinel5のTwitterイラスト検索結果。 3 件

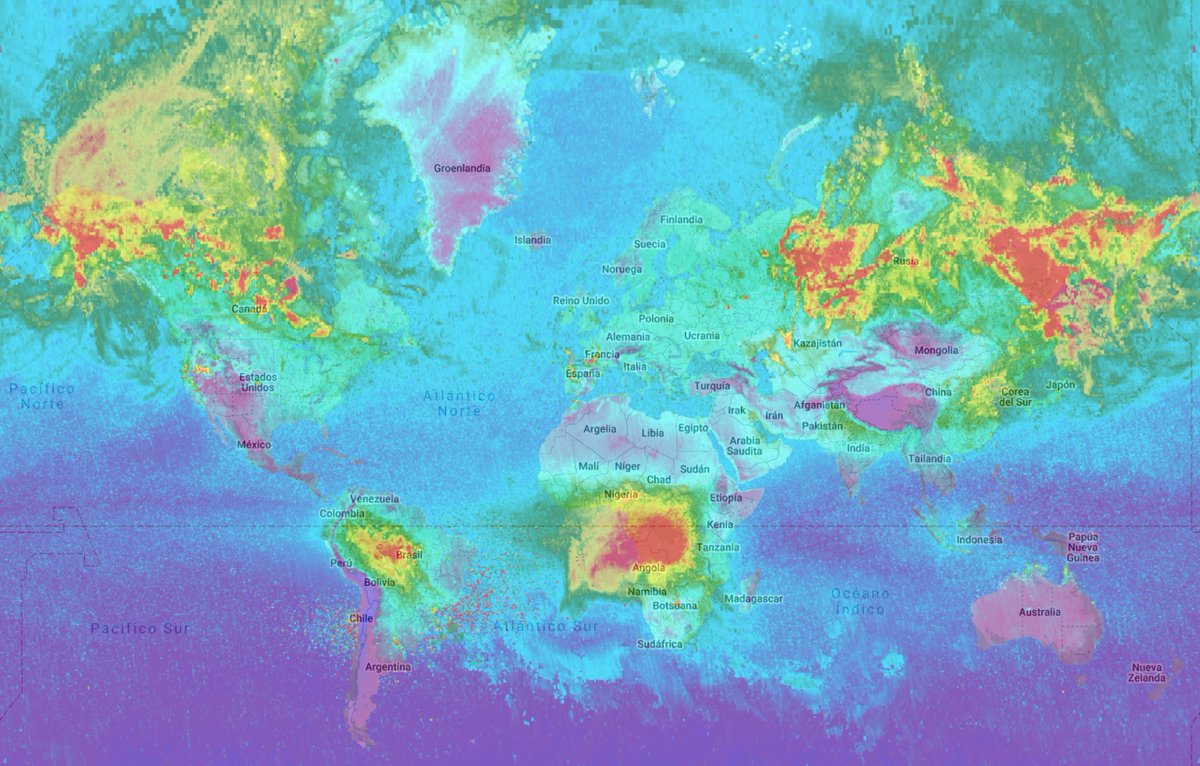
Maximum values of Carbon Monoxide in the last two months; 26th of June to 26th of August via #Copernicus #Sentinel5 🛰️ | 0 ⬛️🟦....🟧🟥 0.08 mol/m^2
50
102

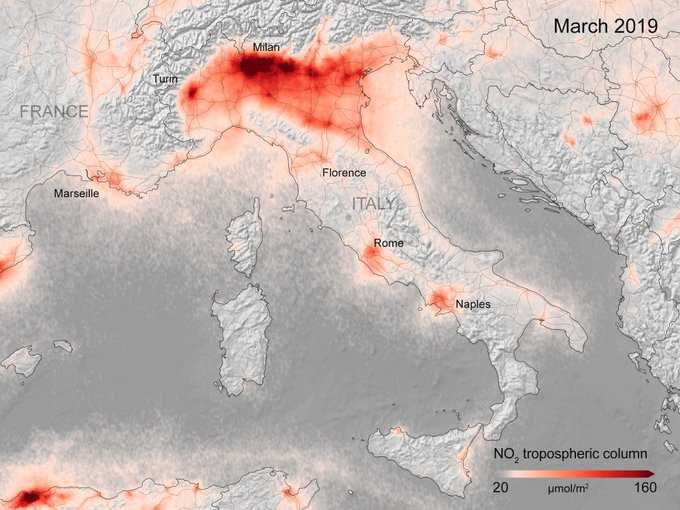
New #NO2 map available for #Italy- based on data from @CopernicusEU #Sentinel5P and processed by @KNMI/@esa.
🛰️images show nitrogen dioxide concentrations from 14 to 25 March 2020, compared to the monthly average of concentrations from 2019.
Read more: https://t.co/0gXGSaJAed
210
351

Trans-oceanic journey of Carbon Monoxide
Max. values between the 3rd-7th January 2020 (0-0.05 mol/m^2). There are more than 10000km from one side to the other @CopernicusEU #Sentinel5 🛰️🔥
#NSWfire #bushfires #AUSTRALIANBUSHFIRES #AustraliaOnFire #NSWfires #Australia #NSWfires
164
229
もし、気にっていただけましたらTwitterやブログで宣伝していただけると管理人が喜びます。
ツイートする