tidytuesdayのTwitterイラスト検索結果。 7 件
Finally.... tiddies on #TidyTuesday ~ New top is almost finished ^-^
Made a variety of maps for this week's #TidyTuesday. The last plot was inspired by @issa_madjid's polio visualization!
Code in #RStats: https://t.co/rvz77YEDQ9
Oh hey its been a while since I did a #TidyTuesday Please ennjoy my bountiful booba~ 😘💙💙💙
#Vtuber
Here is the stream plot we created during my #TidyTuesday #Rstats Twitch stream! It shows the total area affected by drought conditions in the United States from 2001-July 2021.
Code: https://t.co/aAeKS5ZWOZ
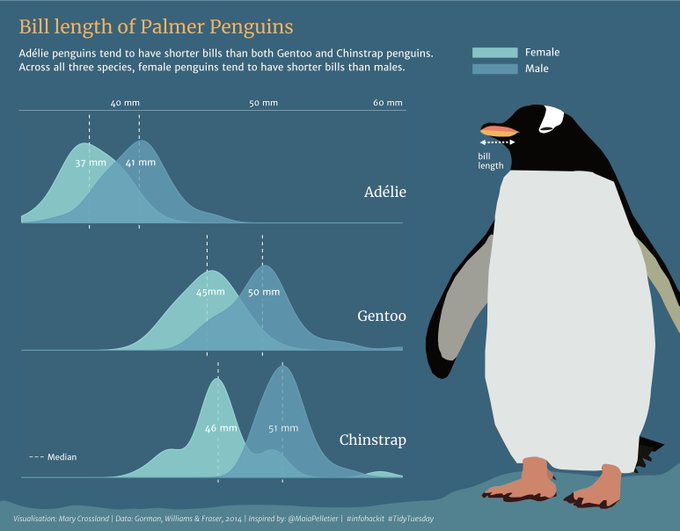
Recently joined the #infohackit online design course for researchers! Here's my first attempt at an infographic using a previous dataset from TidyTuesday - think my penguin is a Gentoo! Next stop, creating some visuals for my PhD research... #scicom #datavis


