RstatsのTwitterイラスト検索結果。 374 件


A forest map of Perú using data from 2019.
#rayshader adventures, an #rstats tale


New to R? Learn how to create customizable data visualizations using ggplot2 with this tutorial. Increase visibility and improve repeatability with a range of visualization options that go beyond point-and-click software
#dataviz #Rstats
https://t.co/FZUR7IXSK0


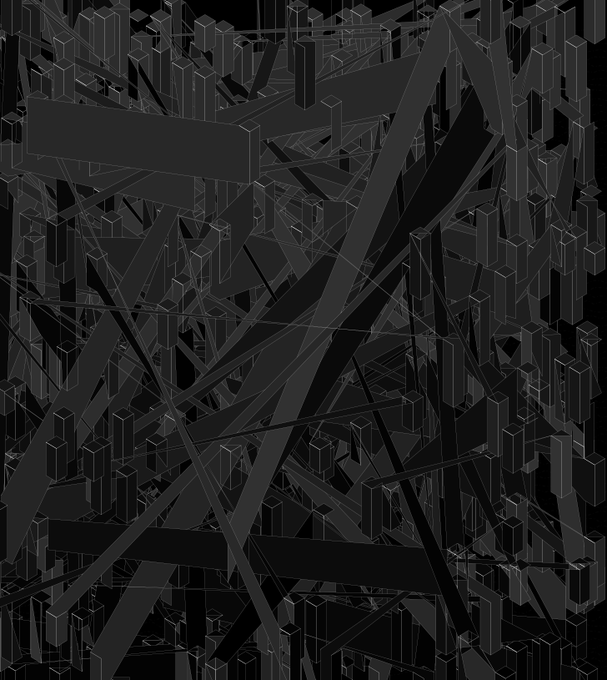


A couple of sketchy generative art pieces today 🎨
The {roughsf} package by @schochastics is quickly becoming one of my favourite packages for generative art!
Colour palettes from {PrettyCols}: https://t.co/CK5RefjtWa
#RStats #GenArtClub #GenerativeArt


Excited to introduce the #Rstats package rang (developed by @chainsawriot and me) which helps to reconstruct historical R environments to make old code run again (ie make it reproducible!). So far, it supports all code back to R 2.1.0 (2005!)
https://t.co/WVbg1pnYhW

Fractalic Sushi 🍣
Code available here:
https://t.co/P33ErjAPVZ
#rstats #generativeart #maths #ggplot2


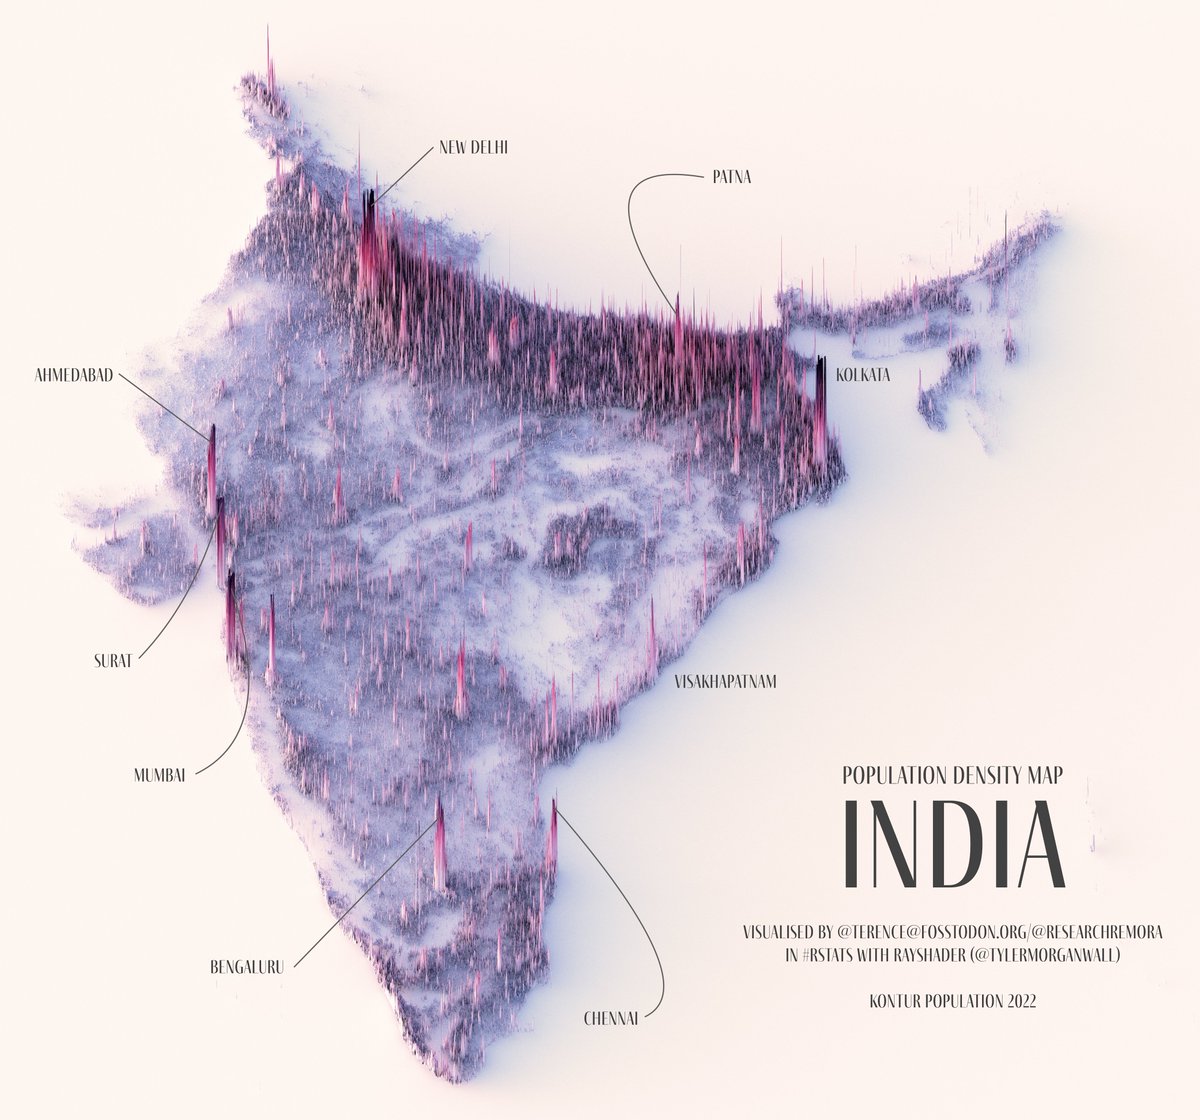
Also had lots of requests for this one: a population density map of India. This was by far the longest render.
Well, except for furry France, which still holds the record.
#rayshader adventures, an #rstats tale

Eclipse: a #generativeart piece based on Physarum Model and inspired by nature (oil on #ggplot2 canvas)
Code available here:
https://t.co/iOYQW1my95
#rstats #maths

Eclipse: a #generativeart piece based on Physarum Model and inspired by nature (oil on #gglot2 canvas)
Code available here:
https://t.co/iOYQW1my95
#rstats #maths

A population density map of the Tōhoku region, which comprises six prefectures: Akita, Aomori, Fukushima, Iwate, Miyagi, and Yamagata. Hope I got all the labels right. 😅
#rayshader adventures, an #rstats tale


Heads Will Roll 02. Created in R with GGPLOT2. One million grid points and more than 400 shapes. #genartiveart #genartclub #wip #Rstats #rtistry #nft #creativecoding


#DataScientists 🆚 #MachineLearning #Engineerss
👉🏽https://t.co/0pg1Xda31m
v/@gp_pulipaka
#DataScience #Analytics #BigData #AI #ML #IoT #IIoT #IoTPL #IoTCL #Python #RStats #CloudComputing #Serverless #NLP #Coding #Programming #100DaysofCode #CodeNewbie #DEVCommunity #WomenWhoCode https://t.co/o8Yw3gz5u6