visualization.のTwitterイラスト検索結果。 35 件


through meditation, you can tap into the power of visualization. you can manifest and bring your deepest desires to life by quieting your mind. create your reality. 🧘♀️✨
#meditation #visualization #mindpower #mentalhealth #dreamy #trippyart #focus #digitalartwork #NFTartwork


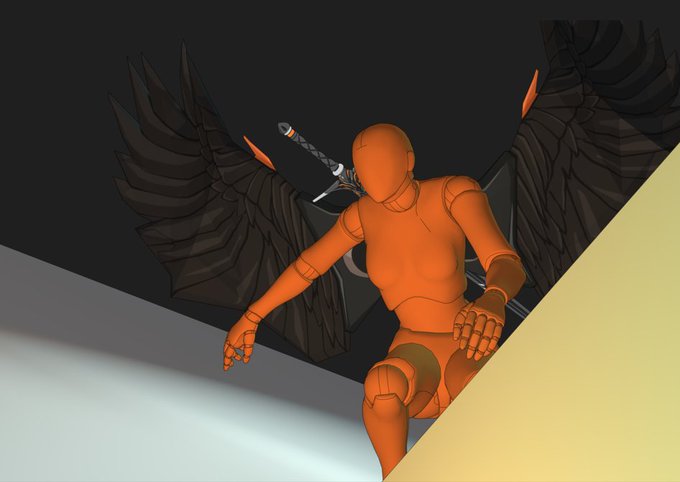
I started working on the animation after making the pre-visualization.
I don't draw storyboards, I think about actions using rough models. This character can fly, so I was able to freely create many actions.


A brief and non-exhaustive visualization. https://t.co/Yw4eY0U1nU


The #butterfly #wing from #exhibition #butterflyeffect in #prague #ar #augmentedreality #artivive included. 150x100cm acrylic on canvas. I am using app #smartist for visualization. #gallery #galerieuzlatehokohouta


messing around; daydreaming about webcomics and ways to streamline my process in such a way that would expedite creation to match visualization. yknow. # justgirlthings


#Shapr3D user Steed Sun (IG: steedsun2049) traveled back in time and designed something that gave him retro radio vibes 📻 Our app is ready to upcycle your product concepts with #directmodeling, documentation, and #visualization. Download Shapr3D now!


This what happens in the Froel brain.
As accurate as I could get it in visualization.


Part4: Today it's time for relative humidity changing throughout the year.
Mean monthly relative humidity, calculated from #dewpoint and #temperature (1981-2020) #ERA5
created with #geemap and #EarthEngine.
The scale is non-linear for better #visualization.
#dataviz #EarthArt

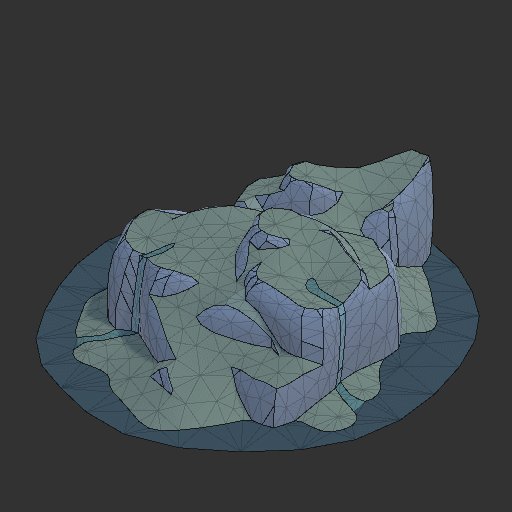
Imma talk about my new island generator at Sweden Game Conference (@SwedenGameArena) on Friday (no idea if its gonna be recorded). Naturally, I'm preparing by implementing some nice timing and visualization.


All World Languages in One Visualization.
Credit @VisualCap


Magic outcome.
Same algorithm, completely divergent visualization. Minter controls color, horisontal/vertical position, seed, vector density, and opacity.
On @EthBlockArt by @rich__poole
https://t.co/Fy4B0KSigy


@davidrmunson @gullevek Always makes me think of that pyramid visualization. It's funny but also infuriating.


Tdov is a good day to post this age progression chart of Zooks I've been wanting to make, right? I don't know how canon this will end up being but it's a start. I've been drawing him younger every now and then anyway but this is a pretty fair visualization.


The map showing the US as an ocean of read for COVID cases while Canada is empty is because US data is mapped at the county level and Canada at the provincial level.
There are big differences at the border, but It's bad data visualization. Better one attached.
Ok, back to work!


One silver lining with COVID-19 was great data visualization. Here’s the tip of the iceberg. Grab this Infographic Datapack on @infobeautiful https://t.co/5nb31NNSRi


Yes, I sketch two times nowadays. It's kind of annoying, but it helps with visualization. The first sketch establishes the composition/pose/movement. The second sketch has more details. Clip Studio's 3D models help fill in the gaps~ #wip https://t.co/HWwZOOMEyz