--> Storyboarding
It's complex creating a series of charts, animated charts, scrollytelling, or interactives.
Use hand-drawn elements to map out how different visuals will work together, transition, or sequence. Also use it to test the composition of a single infographic! 2/5
I have a beautiful Pachira Aquatica (aka money tree🤑🌳) in my office that has these plump looking leaves🌿
Being obsessed with visual metaphors for years, I've slowly developed this brainstorming process to help come up with them faster for #DataViz, illustration, and infographic projects: https://t.co/fSqamgzIXX
I'm not rounding up my fave 2021 vizzes this year, but I do want to shout out the IMPRESSIVE work that Kontinentalist @konti_sg is doing. Their reporting is interesting and includes gorgeous illustrations and #DataViz😍 here's one of my faves...
https://t.co/rwC08GxaU4
I’m getting so many messages that this article is inspiring people to pull up their own chair to the table, and I’m loving every single second of it😭
https://t.co/ojiRTgelIb
how do you illustrate a person pivoting into a #data career?
here’s some behind the scenes of my illustration for my @dataliteracycom article, if you’re interested!
I started with the idea of someone illuminating a path for someone else...
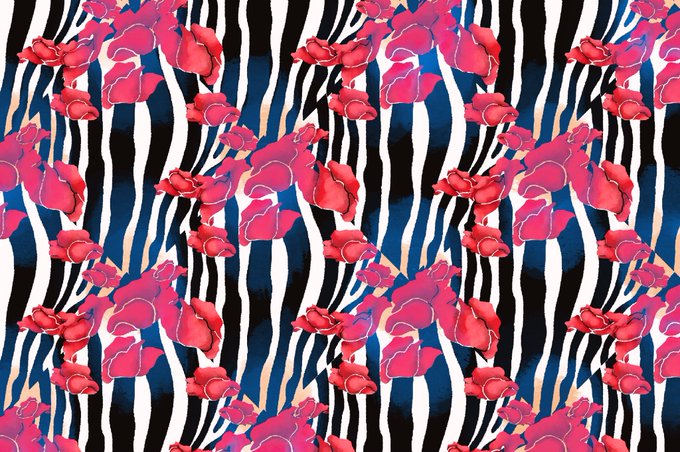
I fell a day behind bc I ran out of ideas...but this one came to me in a dream. Zebra poppies! 🦓🌸
Day 31 of #SciAnimalPrint where I create a pattern based on @mesabree's Project Animalia!
Day 27 of #SciAnimalPrint where I create a pattern based on @mesabree's Project Animalia!
Laughing Dove 🕊 I hope i did this bird justice...just so naturally beautiful
Day 24 of #SciAnimalPrint where I create a pattern based on @mesabree's Project Animalia!
American Flamingo 🦩 inspired by all those pinks (with a bit of yellow?!)


