📢July #European #climate highlights from #Copernicus #C3S:
🌡️Temperatures were below average in the north and above average in the south ➡️https://t.co/MA7J10oJ6l
💧Dry conditions continued in France and parts of central Europe, but wetter in the north➡️https://t.co/E52HVWSc3F
📢July #Arctic #climate highlights from #Copernicus #C3S:
🌡️Temperatures were much above average in many areas ➡️https://t.co/MA7J10GjXT
❄️Sea ice extent was roughly 27% below the 1981-2020 average, on a par with the lowest July in our record➡️https://t.co/NnTu9xxRjZ
🌍Was 2019 a rainy year? The answer depends upon where you live. As this plot shows, within Europe some regions were wetter than average, while many others were drier than average.
Read the full details in our European State of the Climate➡️https://t.co/xAMydpFYGW #ESOTC
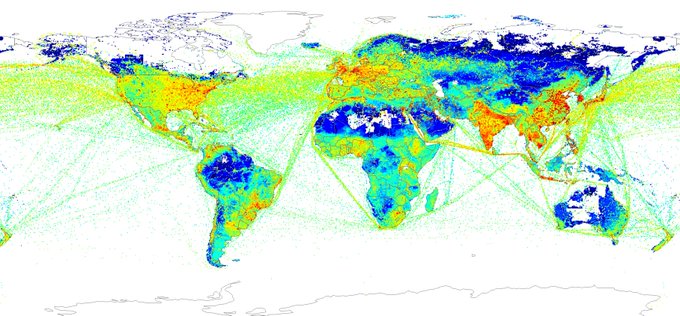
About 90% of goods are transported by boat, so it shouldn't be surprising shipping lanes show up clearly in nitrogen dioxide emissions data from the #CopernicusAtmosphere Monitoring Service
Learn more about how CAMS provides this information➡️https://t.co/Kc1tEgvsPn
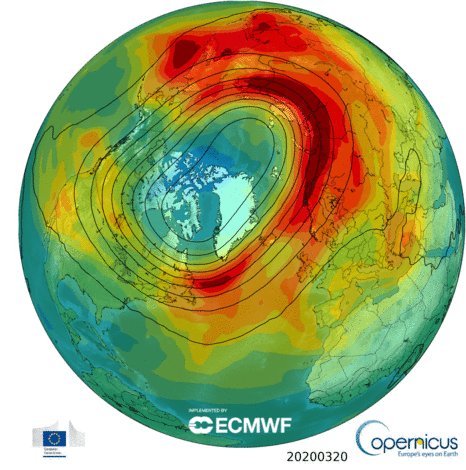
The unprecedented 2020 northern hemisphere #OzoneHole has come to an end. The #PolarVortex split, allowing #ozone-rich air into the Arctic, closely matching last week's forecast from the #CopernicusAtmosphere Monitoring Service.
More on the NH Ozone hole➡️https://t.co/Nf6AfjaYRi
🛰️The #CopernicusClimate Change Service's annual European State of the Climate uses satellite data in its analysis of climate indicators and variables in #Europe. Watch out for the release of 2019's #ESOTC next week!
How #C3S uses satellite data➡️https://t.co/cOTBGQNi2V
📢March #hydrological highlights from #C3S:
💧Wetter than average across large parts of Europe
💧Wetter than average in some parts of the Middle East, with flooding in Syria and Iraq, and drier in parts of South America, especially Argentina
More➡️https://t.co/i2pC6qVDRI
How sure are we that recent changes in #AirQuality are due to #coronavirus lockdowns? The effects are clear where strong measures have been in place for weeks, like China and Northern Italy, but in other places we need to be more cautious.
Find out why➡️https://t.co/0194ipqvN2
The @CopernicusEU #Atmosphere Monitoring Service is celebrating World #OzoneDay by staying on duty tracking 2019's oddball #OzoneHole.
This animation compares it to every year since 1979, showing the variation over time.
Full update➡️ https://t.co/x8j0ldxfkw


