@FuturePerfectTV: “What’s Cookin’?”
A series of Data Illustrations exploring how education level affects one's career, using meal preparation as a visual metaphor. (2/3)
Out of 50+ submissions, we selected 1 winner for the beauty category as part of our annual data visualization survey challenge. We awarded the winner in this category for creating data visualization with the most artistic merit. (1/3)
Note that you must be a member to join the Slack Workspace. It is free to be a member, you can join here: https://t.co/DYMjEzKiBs
Had you told @DataRevelations 4 years ago that he would advocate building a dashboard by committee he would have said you were crazy. Find out not only what changed his thinking, but also how he learned to make better, faster #dataviz working with others. https://t.co/PHdXXuJwge
#FromTheArchives : Spatial Data Archaeologist, @wallacetim, draws inspiration from mapping things that no one has seen before. @colemanrharris presses Tim about his artistic process and the dreaded question of whether he prefers print or digital. https://t.co/BjG8eqD1YH #dataviz
The DVS Slack workspace contains 70+ channels. @yuliakrolik & @o1sound set out to make it easier to discover and join them. The result was a novel Slack app that visualizes public channels in a workspace. Go behind the scenes to see how this idea evolved. https://t.co/8cmelTaYbs
We were lucky enough to get a sneak peak from the preface that @AlbertoCairo wrote for Data Sketches by @sxywu and @NadiehBremer available now! Today's eccentricity is tomorrow's orthodoxy...consider becoming a bit more of an eccentric. https://t.co/en41Krkk14
Ever wonder what the various #dataviz tools look like as people? And need stickers of them? Check out #datavizsociety member @eolay13’s shop!
https://t.co/cmY1bm907J
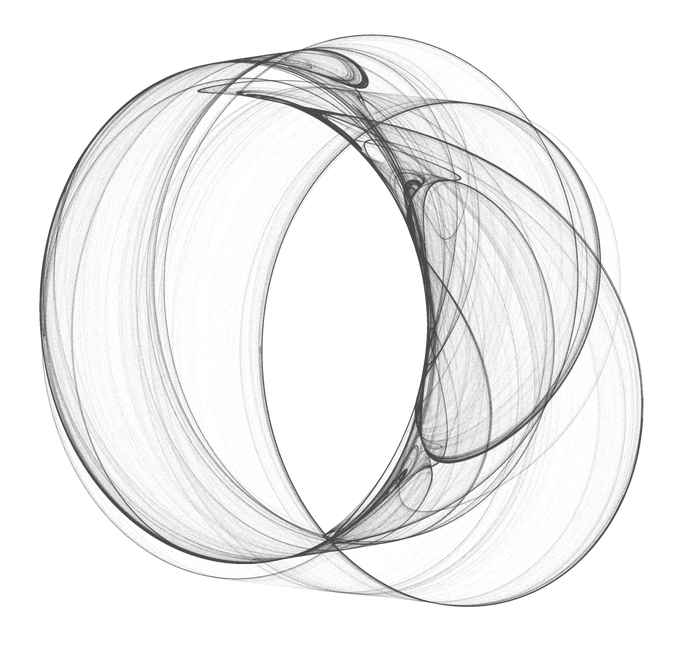
Meet #DataVizSociety member Will Chase (@W_R_Chase), data scientist at Upenn researching epidemiology of tuberculosis in Africa, focusing on dataviz. He works mostly in #rstats & is currently learning #D3js. In his spare time he also makes generative art.
https://t.co/mJYTKJL7dv
Hey #datavizsociety members check your emails for this special #Easter gift: data-driven eggs! Thanks to @martintelefont for the inspiration. #datavisualization


