visualizationのTwitterイラスト検索結果。 850 件中 10ページ目


All World #Languages in One Visualization 🗣️
https://t.co/PtZimx6Dun via @VisualCap
#Culture #DataViz
@JoannMoretti @enilev @Hana_ElSayyed @Shi4Tech @baski_LA @fogle_shane @NevilleGaunt @BetaMoroney @JolaBurnett @AkwyZ @Fabriziobustama @CurieuxExplorer @PawlowskiMario @mvollmer1


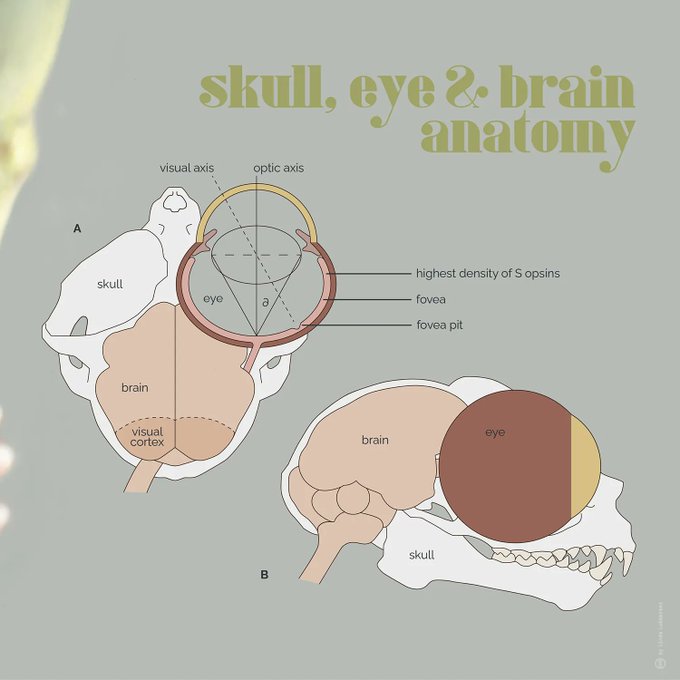
Illustration accompanied by explanatory scientific facts about the #Tarsier and its visual capacities 👁👁 Created by Linda Lubbersen.
Explore more of her work: https://t.co/3I7uC7mbFA
#scienceartist #scienceart #science #naturalscience #scientificvisualization #zoology #sciart


Tried a comic-like visualization of the released 'Dawn of Yangchen' excerpt 🥺❣


I don’t think we can ever represent the mystery of the Trinity perfectly but here’s sort of one visualization of it.
Have a blessed Solemnity of the Most Holy Trinity, everyone.


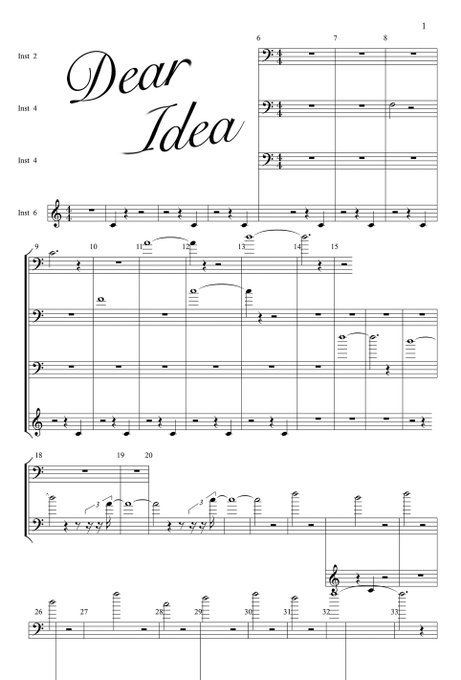
𝘿𝙚𝙖𝙧 𝙄𝙙𝙚𝙖
The visualization of a sound piece.
(1920 x 1080 MP4, 04 minutes 10 seconds)
1/1, 1 $ETH
https://t.co/aaplBwW2eW
https://t.co/GM2Gv8NwNt

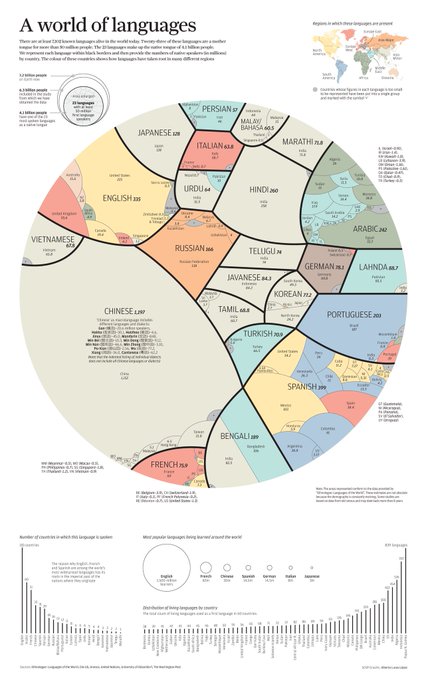
All of the World's Languages, in One Visualization 🌎


my artwork 2022
made by VISUALIMPRESSION and Stefan Haberkorn
https://t.co/t2lG3g6vZV
#architecture #cgi #3d #visualization #cinema4d #rendering #render #buidling #archviz #extrerior #c4d #photoshop #3dmodeling #3dmodel #magdeburg #visualart #visual #mograph


slightly different visualization method -- additive layering helps give a sense of volume without cluttering things up too much


This is a topographical map of S.America and I have drawn the major drainage basins on top. Can you name all of the basins? This map was generated using #Matplotlib #Numpy #Geopandas.
#Python #DataScience #Data #DataVisualization #SouthAmerica.


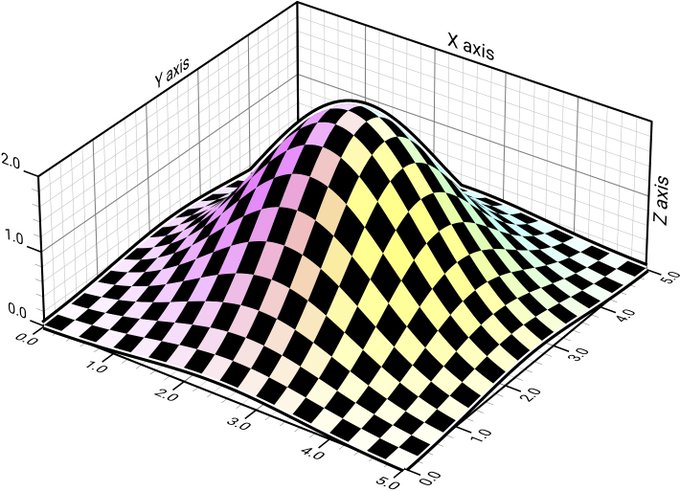

科学技術計算を念頭に、matplotlibによる高度な可視化を解説した書籍「Scientific Visualization: Python + Matplotlib」は、コードとともに全文が無料公開されている
https://t.co/Xj5i2ndPeo

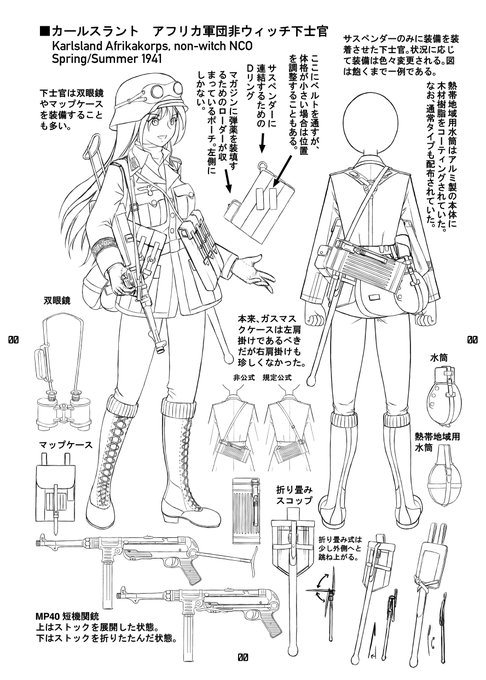
カールスラントアフリカ軍団、非ウィッチ下士官図解
Visualization of Karlsland Afrikakorps non-witch NCO.

Here are all of the rivers and waterways in South America, coloured according to the major hydrological basins they are part of and scaled by their size. This map was generated using #Matplotlib #Numpy #Geopandas.
#Python #DataScience #Data #DataVisualization #SouthAmerica.


@blueycapsules I get everyone talking about micheal and jeremy but the visualization in this single drawing is amazing!!


🚨 AUCTION LIVE 🚨 5 HOURS LEFT!!
current bid : 0.17 $ETH by @lucrafund
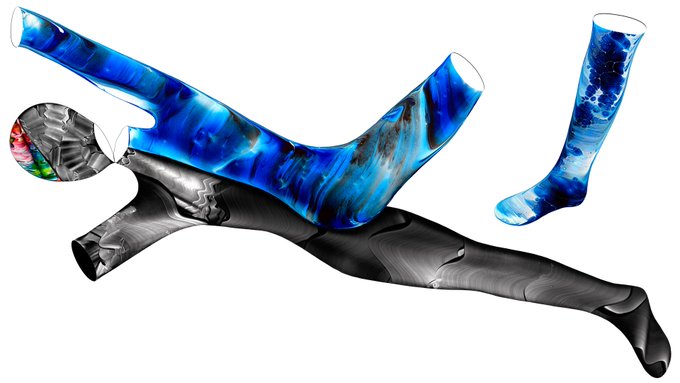
‘Joy of Sounds’ 🎶🫀
a visualization of listening to your favorite songs at the end of the day. nothing feels like it, just pure happiness. 🌇
https://t.co/bNRKzG8jZk
#FoundationNFT @foundation

@web3blair 16 Hours left! to bid on
‘Joy of Sounds’ 🎶🫀
a visualization of listening to your favorite songs at the end of the day. nothing feels like it, just pure happiness. 🌇
https://t.co/bNRKzG8jZk

@NFTGalIery 16 Hours left! to bid on
‘Joy of Sounds’ 🎶🫀
a visualization of listening to your favorite songs at the end of the day. nothing feels like it, just pure happiness. 🌇
https://t.co/bNRKzG8jZk

@knuto89 16 Hours left! to bid on
‘Joy of Sounds’ 🎶🫀
a visualization of listening to your favorite songs at the end of the day. nothing feels like it, just pure happiness. 🌇
https://t.co/bNRKzG8jZk

@1PrecentclubNFT 16 Hours left! to bid on
‘Joy of Sounds’ 🎶🫀
a visualization of listening to your favorite songs at the end of the day. nothing feels like it, just pure happiness. 🌇
https://t.co/bNRKzG8jZk