matplotlibのTwitterイラスト検索結果。 38 件


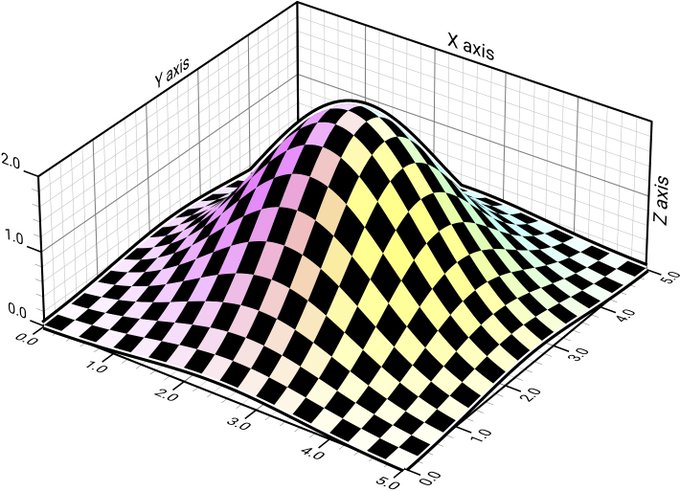
This is it, all my knowledge of matplotlib has culminated in this plot. I am betting seaborn could've done this easier, but something something sunk cost fallacy


Python + Matplotlibによる可視化を徹底解説した書籍がコードとともに全文無料公開されている
Scientific Visualization: Python + Matplotlib
https://t.co/Xj5i2ndPeo


Where do the world's carbon dioxide emissions come from? Darker areas indicate areas with higher emissions. How does your area look on this map?
This map was made with #Python using #matplotlib. #DataScience #Data #DataVisualization #ClimateAction #ClimateEmergency

Contour line map showing the topography of Turkey. I can't decide which colourmap I prefer. Inferno (Top) or gist_earth (Bottom) - What do you think?
Comment and let me know which country I should make next! #DataScience #Datavisualization #Geography #Turkey #Matplotlib

Day 26 of the #30DayMapChallenge - Islands. 3D digital elevation model of Taiwan
This map was made with #Python using #Numpy, #matplotlib and #earthpy. #data #DataScience #data #dataviz #DataScientist #geography #artwork #art


howdy #generative / #glitchart i started playing with wave function collapse again because of @tartaria_rchvst. then i thought pixel sorting would be fun. then i realized i saved the matplotlib figure including axes and you know what, it looks f*ing cool

Day 2 of the #30DayMapChallenge - Lines.
Contour line map showing the topography of Great Britain.
This map was made with #Python using #Numpy, #matplotlib and #earthpy. #data #DataScience #data #dataviz #DataScientist #uk #gb #eu #geography


This Cube Monkey is a Data Scientist for sure. Trying to get everyone in the office to understand the power of matplotlib.
"Take the red pill, python is the way"
#nfts #nft #nftart #nftcommunity #nftcollector #nftartist #crypto #cryptoart #art #freenft

This is a topographical map of S.America and I have drawn the major drainage basins on top. Can you name all of the basins? This map was generated using #Matplotlib #Numpy #Geopandas.
#Python #DataScience #Data #DataVisualization #SouthAmerica.


科学技術計算を念頭に、matplotlibによる高度な可視化を解説した書籍「Scientific Visualization: Python + Matplotlib」は、コードとともに全文が無料公開されている
https://t.co/Xj5i2ndPeo

Here are all of the rivers and waterways in South America, coloured according to the major hydrological basins they are part of and scaled by their size. This map was generated using #Matplotlib #Numpy #Geopandas.
#Python #DataScience #Data #DataVisualization #SouthAmerica.


https://t.co/m6Cp2qFJiB
matplotlibのこちらのチュートリアルを元に、変な雪の結晶もどきを描いた
#matplotlib
#python

Mapping the world's flight paths.
This map shows flight paths in 2022 and was derived from ADS-B data.
Made with #Python using #matplotlib and #Numpy. #DataScience #DataVisualization #Map #shipping #Geography #dataviz #data #DataScientist

Topography map of the United Republic of Tanzania.
The colormap goes black-green-blue-yellow from low to high altitudes.
This map was made with #Python using #Numpy, #matplotlib and #Pandas. #Data #DataScience #dataviz #geography #artwork #art #Tanzania

Population density of the British Raj if it existed today. The dark spots represent cities, can you name them all?
This map was generated with #Python using #Matplotlib, #Numpy and #Pandas.
#Data #DataScience #dataviz #geography #Humanity


Topography map of France. Colours correspond to the of the national flag. #TopographyTuesday
This map was made with #Python using #Numpy, #matplotlib and #Pandas. #data #DataScience #data #dataviz #DataScientist #eu #geography #artwork #art #France #Map

Topography map of Kenya. Colours correspond to the of the national flag. #TopographyThursday
This map was made with #Python using #Numpy, #matplotlib and #Pandas. #data #DataScience #data #dataviz #DataScientist #eu #geography #artwork #art #Kenya #Africa #Map


What does the world really look like? As we all know the earth is flat so here is the map of the world that we should be teaching in schools. Day 28 of the #30DayMapChallenge - #Python #Numpy, #matplotlib #. #data #DataScience #data #DataScientist #icewall #FlatEarth #sheep