VisualizationのTwitterイラスト検索結果。 850 件中 15ページ目

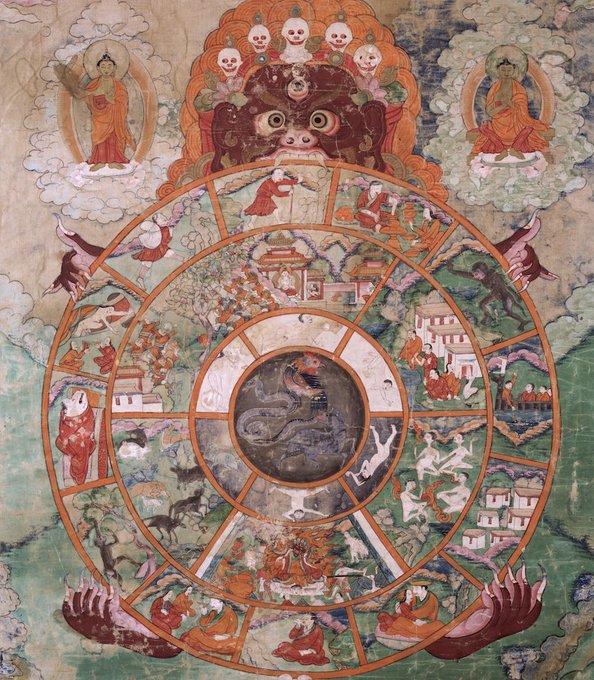
#HappyGroundhogDay! Did you know the movie Groundhog Day can be viewed as Buddhist? Phil Connors finds himself stuck in a time loop, similar to the concept of samsara. Depicted here is the Wheel of Life, a Tibetan Buddhist visualization of this endless cycle.
🏷️ F1997.40.10


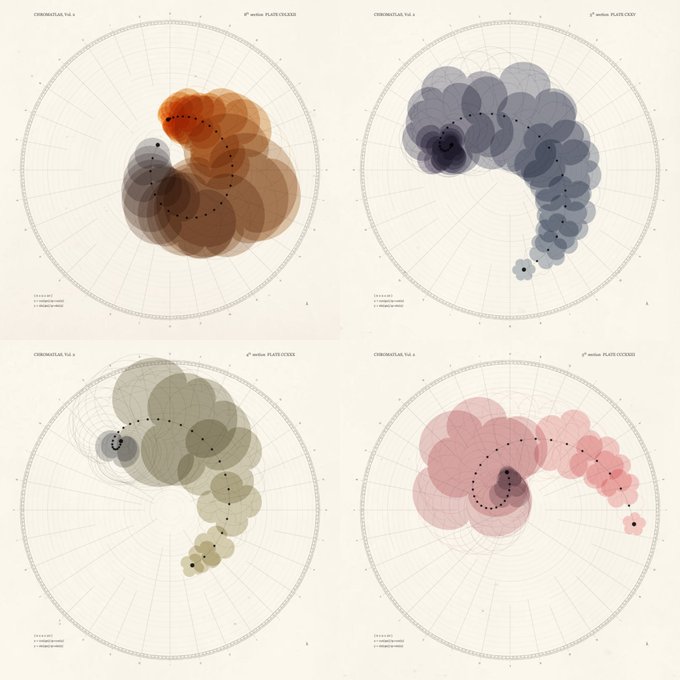
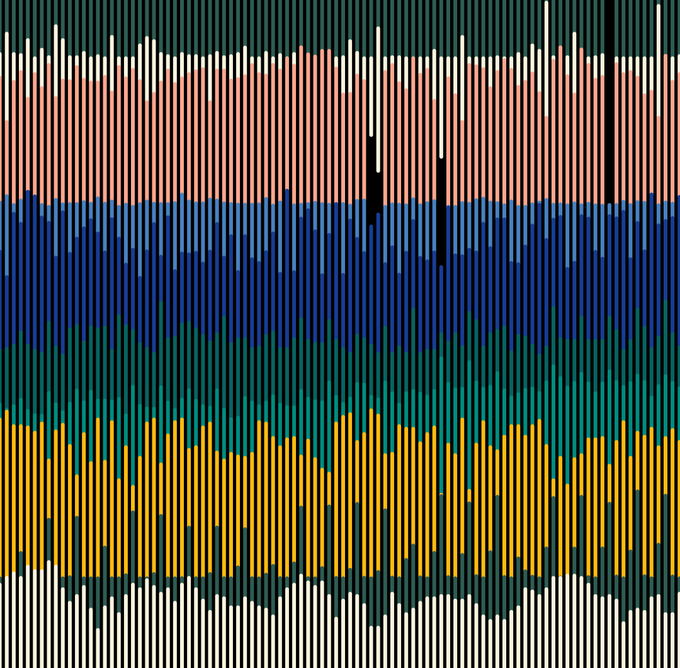
CHROMATLAS, Vol. 2 #72 by @alexis_o_O
https://t.co/iOvHJjfcCO
One of my favorite pieces/collections because of the elegant framing, visualization, and color variation. Try dragging the terminal nodes around! Images: (1) thumbnail preview, (2) four selected variations.


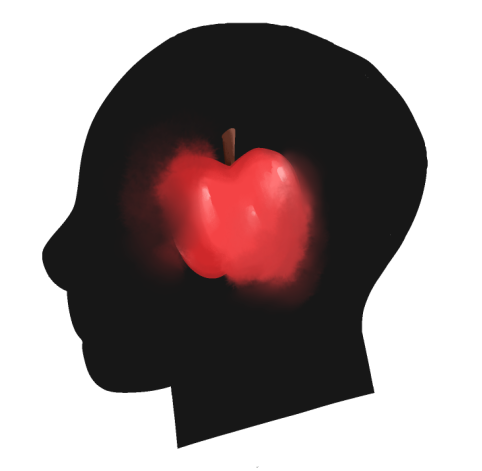
@LeftLost4 this is my first @withFND drop, i hope you like it!. i put this as a visualization of listening to the beautiful sounds of music after a very long day. the character from this piece is ‘Sonds’, and she loves crafting melodies🎵🙌
🔗https://t.co/JGESvTlsII


@jf_nft Thanks a lot for the support!
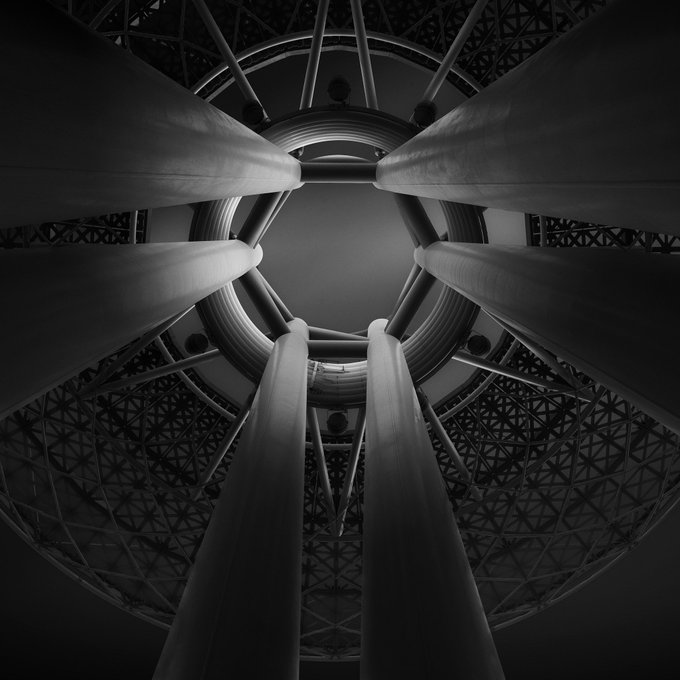
I would like to bring you attention to my very recent collection “Uncluttered Sobriety”
A series of fine art photographs created on the basis of an imaginary visualization of the artist. Essence, with style and sobriety.
https://t.co/poAzR4rQZE


Been working on implementing an octree image quantization algorithm in Python. The best thing about it are the visualizations 🤩.
Before and after reduction of the octree.
#python #graph #visualization


Absolutely EPIC project (on ETH) by @nadiehbremer!
Rarely do you see data visualization weaved into generative art as elegantly as this.

Prompt #22 - Genuary 2022: Make something that will look completely different in a year. Abstract animated visualization of Quality Air data in 2021 (SO2, FL_SO, NO2, O3, ...) from a station near home.
#genuary2022 #generative #generativeart #dataviz #p5js #ClimateCrisis #data


The truth comes out! Yookey is a butthead! I repeat, Yookey is a Bratty Butthead. :3 Just ignore the other half about the blue stuff.
Yookey is such a wonderful goober, Thank you for this visualization of pretty much the majority of our interactions. <3
Artist: @YookeyArt


Piero della Francesca’s works — my latest data visualization designed for @La_Lettura: https://t.co/btAWL0beDh
#Datavisualization #dataviz #infographic #ddj


Here's a visualization of the masks in VTubeStudio
(it feels clearer with opacity a bit on)


Zoological illustration by #LindaLubbersen of a neonetic salamander, the Axolotl (Ambystoma mexicanum), accompanied by explanatory facts about this species.
Explore more: https://t.co/3I7uC7mbFA
#scientificvisualization #scienceart #scientificillustration #SciArt #salamander


CLIP (ViT only) feature visualization notebook using Deep Image Prior and based on @danielrussruss 's CLIP guided DIP notebook: https://t.co/3fJg5CkItO. Some outputs:

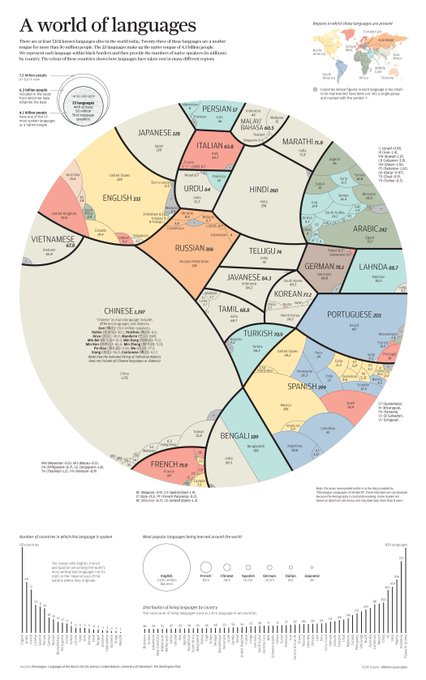
MISCAll World Languages in One Visualization
https://t.co/IkrjVUEuji
흥미로운 그림. 한국어 사용이 생각 이상으로 큰 규묘. 독일어 사용에 필적하고 그 구성의 다양성은 일본어보다 우월하다. 백낙청 등의 한민족언어공동체론을 비웃었는데 이리 보니 마냥 비웃을 건 아닌 듯하다.


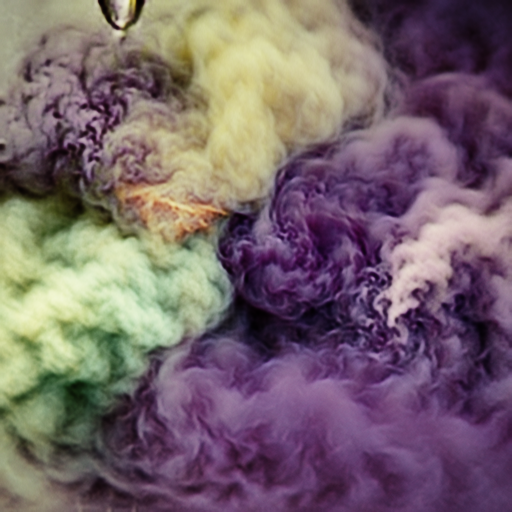
hello lads, this is a piece of art that I generated using AI. It's a visualization of a psychedelic trip that cannot be explained by words and needs to be experienced!
Check it out on open sea
https://t.co/Fpl1z3Azeb
#nft #nftfeed #AI #Generativeart #OpenSeaNFT #opensea


My new project is out! It’s a data visualization on Piero della Francesca’s works, designed for @La_Lettura. It’s in newsstands in Italy this week!
https://t.co/G0MW5xyCxG
#datavisualization #dataviz #infographic #ddj


Explanation of the fourth reason:
Observe this helpful visualization by @.DueK__


The new tutorial is online 😊! It is about styling a Magnetosome protein (MamP; pdb 4JJ0) in #Blender3D. Here are some before & after shots. I hope you enjoy it and find some inspiration for your next scientific visualization!
#sciart #scicomm #youtubetutorial #b3d #tutorial


C0SM0N4UT4 🌌🌗🪐
////Custom Lorenz Attractor Interactive Mod 2 VVisualization////
Based on attractors listed in this catalogue:
https://t.co/7HGExQNflx
+the Lorenz systems visualization algorithm by @shiffman ;
@ProcessingOrg P3D+Ps
Space prompt by @MAKIO135 for #genuary2022


A visualization of my jumil wattpad, smoke hyunjae & juyeon!! This beautiful piece was made by @/musyf_ on Instagram!
I had asked abt reposting, and they said it's okay!! But please kindly check on the real post, give them likes and nice comments <3
Url: https://t.co/GdX1GgZJ7f