VisualizationのTwitterイラスト検索結果。 850 件中 16ページ目


This brilliant gif by Eleanor Lutz shows how different animals breathe through a visualization of the process for different species. Hi-res version and more animations on her website: https://t.co/nveW0oIUIO


Maybe others are already doing this, but I don't recall seeing anything like this in the wild.
Besides Tissot's indicatrix, another visualization option would be the gradients output by daan Strebe's Geocart.


@adieudite yo, sorry bro kinda late
here is my visualization of your Level up oc above, hope you like it🥳🥳🥳🥳🥳🥳🥳🥳


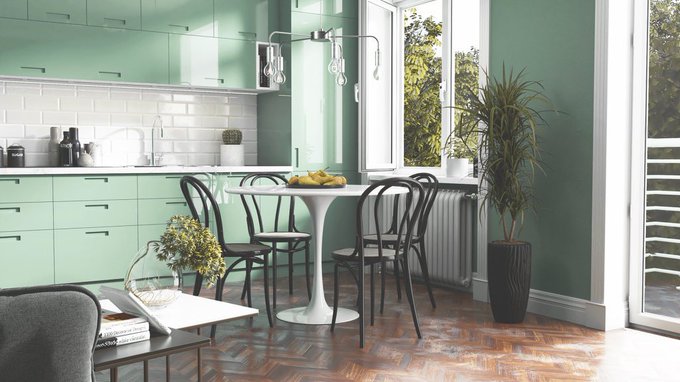
Self initiated work. 'The Treehouse'. Ok, if I can't live in a lighthouse, then a treehouse near the sea is a good plan B. I'm ok with that. https://t.co/62psHr5Rhj #treehouse #treesforlife #greenliving #greenerworld #greendesign #architecturevisualization #greenarchitecture


Tiny Bonus
In the end I decided to do all of them.
Basically just a visualization of #Nagito and my #Sona’s relation to each other.
Base by @_Commi_MoMo
#danganronpafanart #danganronpa #nagitokomaeda #chibi


One of the sickest Sentinel-2 visualizations I have ever seen from @erindataviz. Full write up with code snippets and everything here: https://t.co/Aobbi7Cucb


indeed, they are words, characters built from an alphabet. Stock images are plain visualizations of the tags used to retrieve them. Everything is conventional in this picture, except the final picture. https://t.co/GHo4NYDBGC


Literally visualization of my artstyle struggles over the course of last couple months
The worst struggle is keeping track of proportions
I draw using my intuition without building the fuckin proportions https://t.co/igJZ2nFtFj

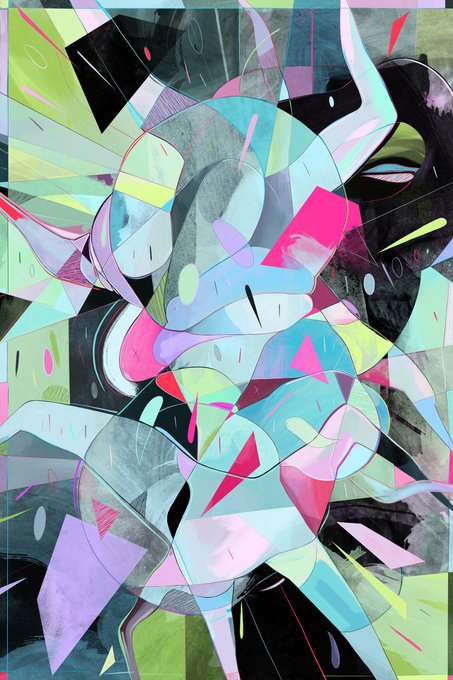


My work is an investigation of consciousness, the human condition, technology + the universe. Using abstraction, I create visualizations of these different, yet interconnected subjects. Painting is a way for me to explore and understand how it is that we're here.


🌟 [Imagino] for Astral/Celestial/Dream
Sav Imagino, Acca~!
This creative Marten uses their paintery flag to sketch and do their sorcia, giving illusions and visualization of things!
https://t.co/usnohW9Vw9
[ 💛KaieraArt 💠FiaSavember ] #15


AAAAAA just presented our genshin impact dashboard for our data visualization class and received praise from the panelists (2 out of 3 didn't even play) ahfksdfh nakilig ako /////

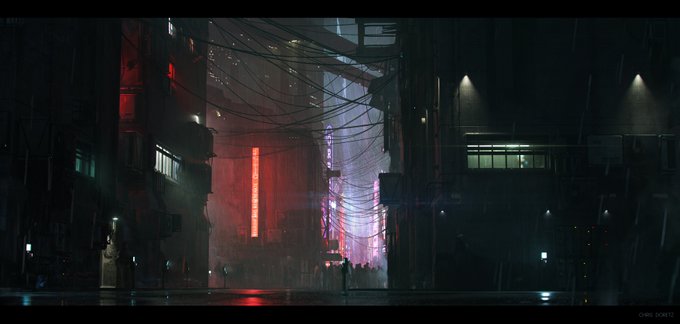


Chris Doretz is a Senior Concept Artist and Industrial Designer for the games and film industry he is based in Manchester, UK. Experienced in architectural visualization, consumer electronics, transportation and environmental design.
#loveart #thattick #illustration #conceptart


Hello there #GlobalSouthArt ❤️
My name is Plume, and I love playing with color! Am open for illustration and children's book visualization work ☺️
📧 prismplumeofficial@gmail.com
🔗 https://t.co/pszhB617Gc


Something a little different for #FossilFriday. I've launched my website #NorthernRogueStudios! Take a look if you want to see some of my scientific visualization and reconstruction. Get in touch if you're interested!
https://t.co/fNBa7SQVba


Since I'm talking about Transformers here, let me say the way Nemesis Prime was done is bullshit. Could've put a whole clone here and it'd be so much better. I'd love to see Prime fight a visualization of his inner demons


Sometimes those illustrations go their own way (here's e.g. an earlier draft of above's reconstruction of #PlantFood processing at #GöbekliTepe).
That's the fun in #visualizations: discussing all this fascinating research with the colleagues - and adding new results on the go.


#4 by @RosieKHart. different type of graph looking at my Hover Fly observations. Note how observations increase during the summers and Toxomerus (Calligrapher Flies) dominate. Isn't this graph pretty?
#GraphoftheDay #Datavisualization #Rstats #sciart @inaturalist