visualizationのTwitterイラスト検索結果。 848 件中 17ページ目
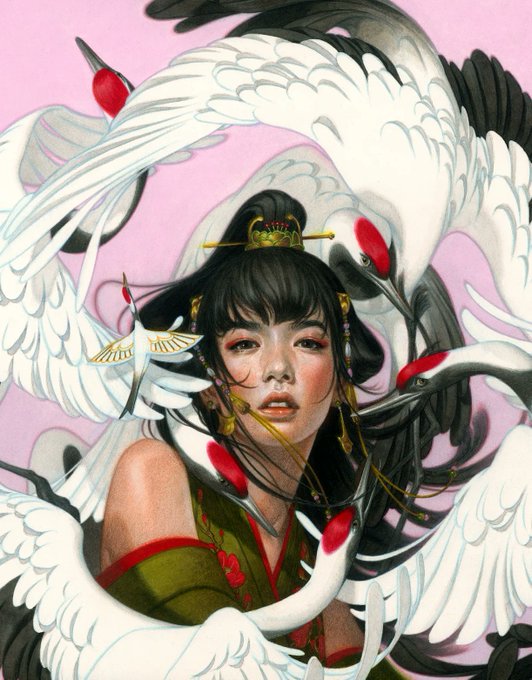
‘Six Crimson Cranes’ is @my_name_is_tran’s visualization of the story about a heroic princess in exile and her six brothers who are cursed to transform into cranes during the daylight. Do you feel the energy of princess Shiri and the movement surrounding her?
#beautifulbizarre
Visualization of nerve pain/ phantom limb pain #painting #digitalpainting #digitalart #art #furryart #furry
The postgraduate digital exhibition show is live now, encompassing work from students across six courses including Graphic Design and Visualization, Ergonomics & Human Factors, Integrated Industrial Design & User Experience Design :
https://t.co/wAGM55FT7B
@LboroCA @lborodesign
[Gotham Zoo]
New artwork, hope you like it! #conceptart #enviromentart #artwork #digital3d #gotham #batman #zoo #halloween #digitalart #visualization #3DSMax #photoshopedit
better res: https://t.co/LumDfclliN
Made a variety of maps for this week's #TidyTuesday. The last plot was inspired by @issa_madjid's polio visualization!
Code in #RStats: https://t.co/rvz77YEDQ9
Part4: Today it's time for relative humidity changing throughout the year.
Mean monthly relative humidity, calculated from #dewpoint and #temperature (1981-2020) #ERA5
created with #geemap and #EarthEngine.
The scale is non-linear for better #visualization.
#dataviz #EarthArt
Starting with this picture, I'm going to gradually create the concept visualization of the world of "Pandenamia". The fandom was created by my friend and dungeon master of the game that I've playing for several years.
I tried making a visualization of Enna's bird related trauma.
#Palouette
One of my previous 2D layout to 3D visualization of a piping project using SketchUp.
'tis the season of the spook.
an ai visualization of henri cazalis' poem:
a danse macabre.
https://t.co/q0hNaMpCsV
https://t.co/HpuPh4FlRt
https://t.co/AwmcW7AaEC
0,1 tz
all shall burn on halloween.
(btw, #hicetnunc makes it look tiny, but they are almost 4k)
#CleanNFT #NFTdrops
This piece is a visualization of one of the songs of @dominosmusic album Presessence.
If you want to own this and 7 other amazing pieces by amazing artists + amazing music just mint the album here: https://t.co/7qQjh8yRFS
ONLY 0.0777 ETH
I will sell some pieces so I can afford an #888InnerCircle genesis ✨. This is my #nftaffirmation for today ☺️🙏❤️ https://t.co/Jwf17NJJzy
#affirmations #visualization #thirdeyeopen #nftartist #NFTCommunity #coherence
@Gozutrucker69 This do anything for you. Keep in mind picrew makes my visualizations limited
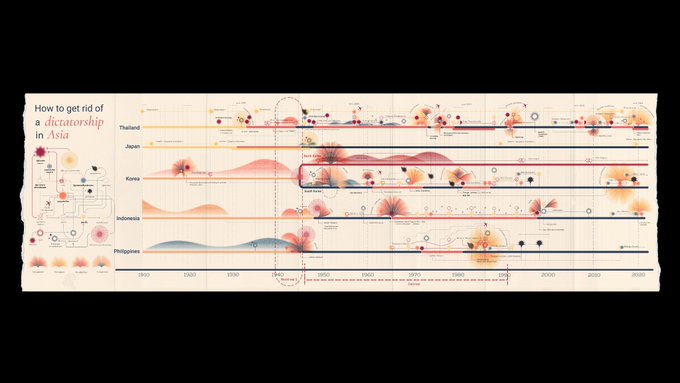
How to get rid of a dictatorship in Asia
คู่มือการกำจัดเผด็จการในทวีปเอเชีย
เป็น Data Visualization เพื่ออุทิศให้แก่ทุกชีวิตในเอเชียที่ต่อสู้เผื่ออิสรภาพและประชาธิปไตย ตลอด 100 ปีที่ผ่านมา ทั้งจากการเจ้าอาณานิคมและรัฐบาลทหาร โดยเล่าผ่าน timeline
เพราะ กาลเวลาจะอยู่ข้างเราเสมอ
Playing with some new golden color 🪙 pallets on some $ZEC plots at its 364 $USDT peak, a little peak at part of the up coming cryptoCANDLE drop!
#NFT #cryptocurrency #cryptotrading #Datavisualization #NFTartist
In case the bare text of the parable of Dives & Lazarus [Luke 16:19–31] isn't enough, here's some visualization:
Dives Carried Away by Devils.
Gouache after H. Aldegrever's engraving. Flemish, c.1590.
(V&A Museum, London)


