visualizationのTwitterイラスト検索結果。 850 件中 3ページ目


New to R? Learn how to create customizable data visualizations using ggplot2 with this tutorial. Increase visibility and improve repeatability with a range of visualization options that go beyond point-and-click software
#dataviz #Rstats
https://t.co/FZUR7IXSK0


Fantasy Art? ...Or a penciled visualization of my retirement in the far distant future? 🎨Alan Lee
#art #fantasyart #illustration #wizard #gnome #writer


Dusk till Dawn
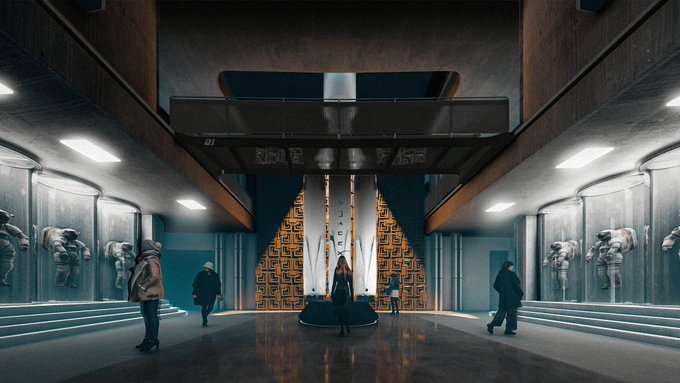
"Astronomika" [3/3]
S.4 Y.2- End of a Thesis: of An Institute for Interstellar Learning and Exploration
"Space for Space Explorers"
#architecture #render ##render #architecturevisualization
#archviz
#archilovers #Dune


Now that the 15 main designs I made myself a simple size chart for better ✨visualization✨


A gem of Soviet data visualization from 1933 - ЖЕНЩИНЫ В СОЦИАЛИСТИЧЕСКОМ СТРОИТЕЛЬСТВЕ СОЮЗА ССР [Women in Socialist Construction of the Soviet Union].
https://t.co/nBznSt3sxw


Bit of Saturday night fun. Here is a contour map showing topography of Northern Europe during the last ice age when sea levels were 122m lower. What would the world be like if Doggerland still existed? #Data #DataScience #Datavisualization #DataScientist #Geography #Europe

Contour line map showing the topography of Nicaragua.
This map was made with #Python. Comment and let me know which country I should make next! #Data #DataScience #Datavisualization #DataScientist #Geography #Nicaragua


Contour line map showing the scale of South America. I used 50m contours and created the dataset with GDAL.
Comment and let me know which country I should make next! #DataScience #Datavisualization #Geography #Brazil #India #Colombia


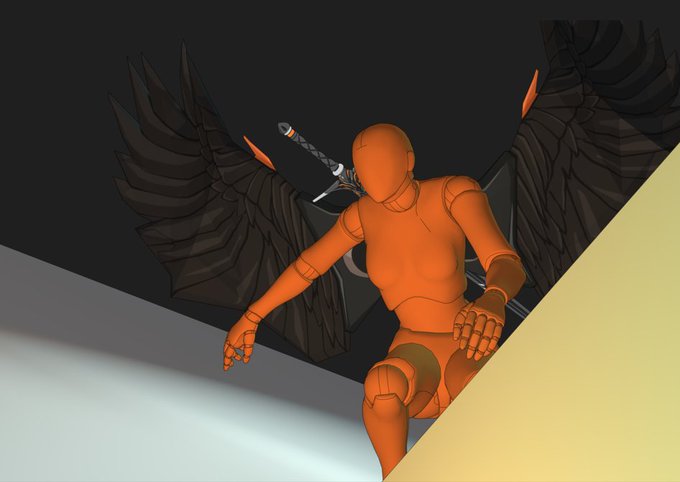
I started working on the animation after making the pre-visualization.
I don't draw storyboards, I think about actions using rough models. This character can fly, so I was able to freely create many actions.


On types of skill:
1) A hand-made woodblock print combined with AI @sonyamova
2) Data visualization combined with AI @DataVelvet
3) Multilingual poetry combined with AI @marta_gazzola
4) plaster cast sculpture combined with AI @NoortjeStorteld


@shoonabee Ppl with hi def visualization recall watching graphic horror movies lol

"How the Vast Spectrum of Data Fuels Your Data Visualization Project" https://t.co/MxHP6audiN This eBook examines a new spectrum of #dataviz & illuminates how meaningful projects can emerge from aspirational abstract concepts or from definitive numbers, & everything in between.


@EGronk just in case a hastily cobbled together visualization was wanted


Gm fams, today upcoming drop
five talented artists that are rarely seen on your radar.
wild imagination and visualization in 3D can spoil the eye and give its own beauty.
🧵


The ketam tattoo on his arms is actually the visualization of animals that lives underground. It symbolizes the life of human, the Dayaknese especially, that is always in touch with the earth and ground they live on.

Contour line map showing the scale of the Himalayas. I used 50m contours and created the dataset with GDAL.
Comment and let me know which country I should make next! #DataScience #Datavisualization #Geography #India #China #Bangladesh #Himalayas


I'm stupah! A 3d artist with product visualization experience as well as experience in modeling/texturing for stylized games work.
https://t.co/rG3h1L177g
Contact: jbqalves@gmail.com


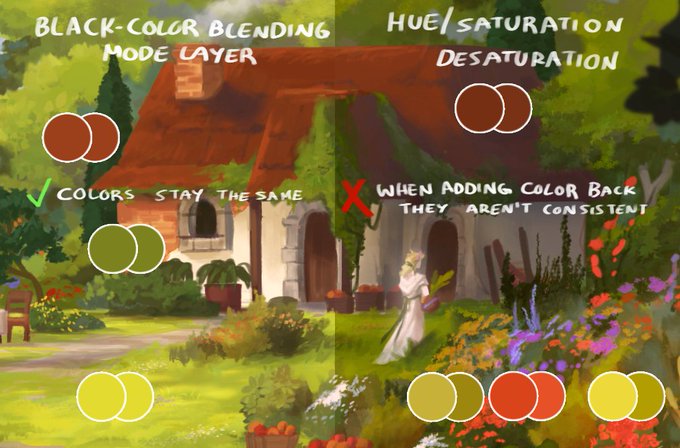
here is a quick visualization! I added color back with the original layer in Color blending mode, and it stays the same, but the Hue/Sat just moves values around "randomly".
I'm not sure why this happens since I'm no programmer 🤷♀️ https://t.co/SReuiqCZJc


