VisualizationのTwitterイラスト検索結果。 850 件中 26ページ目


Femme Fatale #1 "The Siren's Call
"Femme Fatale # 1 "La llamada de la sirena"
a small visualization of the cover variants ❤
#Irene #malucomic #MaluStudio #Femme_Fatale

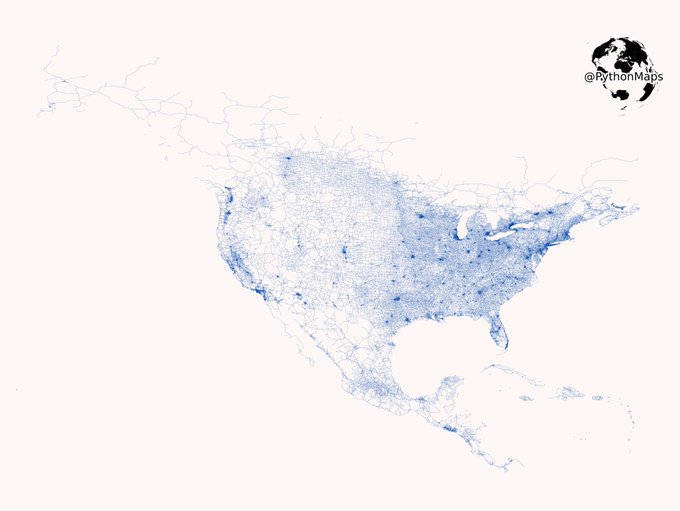
Vroom Vroom. Today’s map shows the public, tarmacked roads of North and Central America. Zoom in! This map was generated with #Geopandas, #Numpy and #Matplotlib.
#USA #Python #Maps #DataVisualization #Data #DataScience. 1/2


Love this visualization of the #Worldmind...
✨
#Nova #10 & #11 (Vol. 6, 2016)
✨
W-#SeanRyan,A-#CorySmith,C-#AndresMossa,L-#AlbertDeschesne
✨
#SamAlexander #RichardRider #NovaCorps #Xandar #XandarianWorldmind #Marvel #MarvelComics #MarvelCosmic


The map showing the US as an ocean of read for COVID cases while Canada is empty is because US data is mapped at the county level and Canada at the provincial level.
There are big differences at the border, but It's bad data visualization. Better one attached.
Ok, back to work!


Today I got acquainted with the works of a very interesting artist - @Kawells00
His visualization of power is awesome. So bright and colorfull. (*・ω・)ノ
Amaizing person with a strong life! I will continue following his work.
#artwork #drawing #artistontwittter #AnimeArt #anime


@GodlyFlat We're talking about the anime not the manga. In the anime it's base form as described in BoG - ritual SSG power turned into Goku's OWN power. BTW Similar visualizations have been used for Goku and the Oozaru when he was a child - it was NEVER a new form tho.


The Mayors Dialogue on Growth and Solidarity: Data visualization website that explores African & European cities collaborating to take action on human mobility. Website: Federica Fragapane, Alex Piacentini Project: ODI https://t.co/1h3OMjFL5B


I'm a generative artist from Argentina who is interested in autonomous behaviors and data visualizations.
I also do interactive and immersive installations where different technologies and languages converge.
#NFT #CryptoArt #PortfolioDay
https://t.co/D8D2Qlu9gO


Surprise #PortfolioDay ! My name is Joseph Brown and I am a graduating senior at A&M with a major in Visualization and a minor in Comp Sci.
I like drawing robots and characters with helmets. I can also do 2D and 3D animation to boot

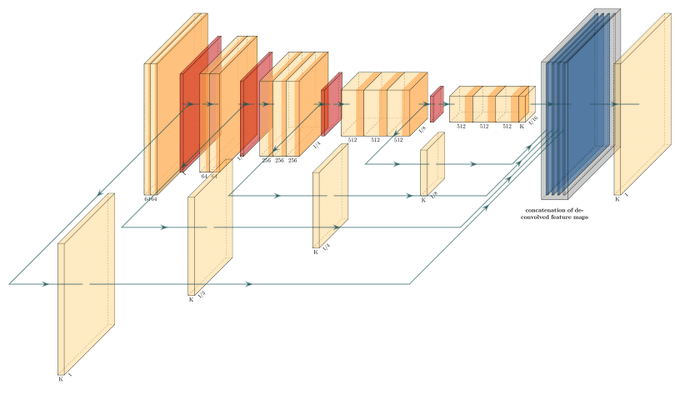
Woah wish I knew about this existed sooner: https://t.co/2y9yOtwSIV. Generates LaTeX for beautiful neural network visualizations (like the FCN-32 shown below).


"whats it like outside?"
a visualization of Cavetown's song Telescope
#furry #furryartwork #furryfandom #Furryartist


One silver lining with COVID-19 was great data visualization. Here’s the tip of the iceberg. Grab this Infographic Datapack on @infobeautiful https://t.co/5nb31NNSRi


These are the preferred proportions so i coloured em up and now, the as of so far perfect visualization of Sweets i can muster


I also really love seeing Yoosung and Zen hang around Zen's basement... Just having an actual visualization of these two hanging out is so damn funny and cute LOOL look at Yoosung sulking???


// gore , blood
.
.
wanted to draw my visualization of the damaging potions :] this was a lot of fun to do! https://t.co/0pEwsRkfy9


Merry Christmas & happy new year! Much artistic license was taken with this, just having fun with AutodeskMaya. when I was reflecting on this year with the Animation lab, I realize just how lucky I am being part of this scientific visualization community


"Aero Snowman" Augmented Reality Holiday Card! ☃️
We created this together with "The Rolling Heads" for
@Adobe
Link👇 https://t.co/DdyCosKyD0
#ar #vr #adobe #adobeaero #holidaycard
#characterdesign #3dmotion #3dvİsualization

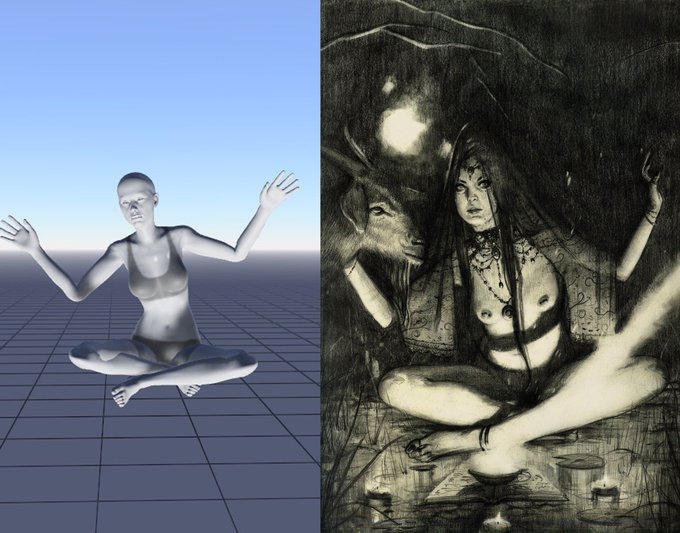
Want to draw like a pro?
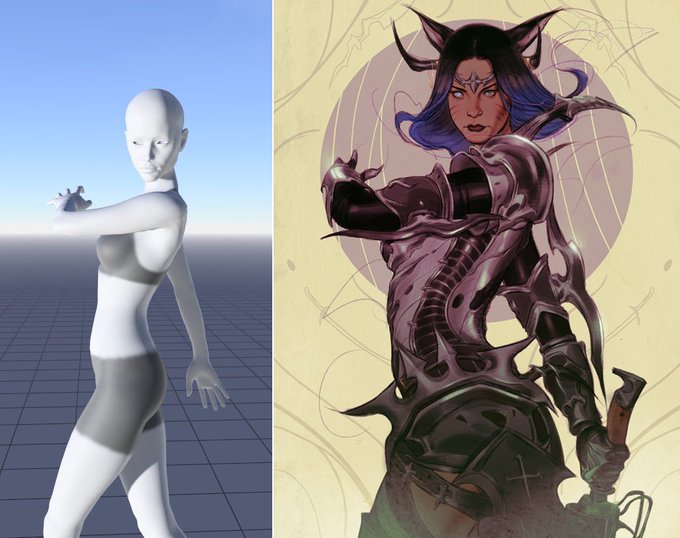
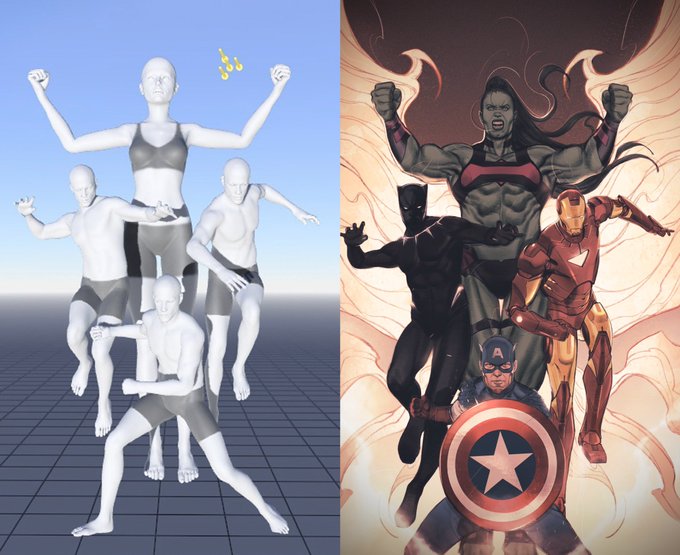
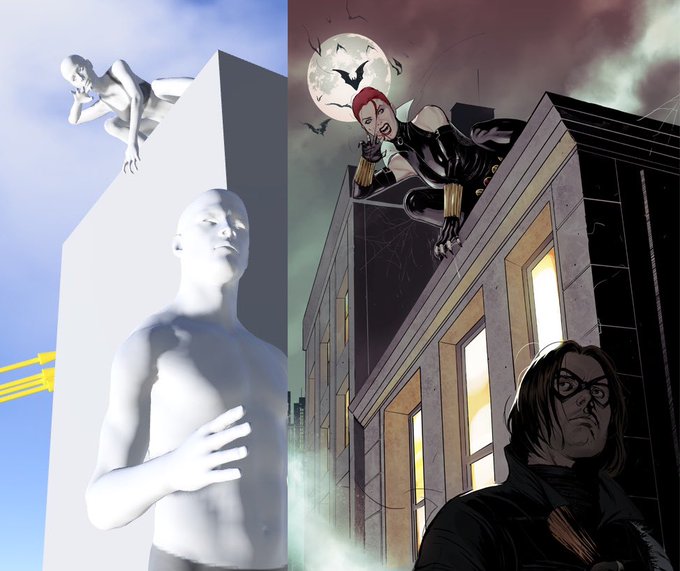
@JSwayArt shared comparisons to show how they use #MagicPoser as reference in their work. Helps their visualization come to life with poses/ lighting they want to convey in the final piece. ✨
Most artists —including your role models— use reference. ❤️


I'm also a college student from eastern tennessee majoring in digital media with a concentration in visualization, character design, and concept art!


@Headspace I decided to illustrate what the sunlight visualization looks like in my mind’s eye. It was such a hard exercise for me at first. Now I’m starting to get the hang of it. ☀️ 💛