visualizationのTwitterイラスト検索結果。 850 件中 29ページ目

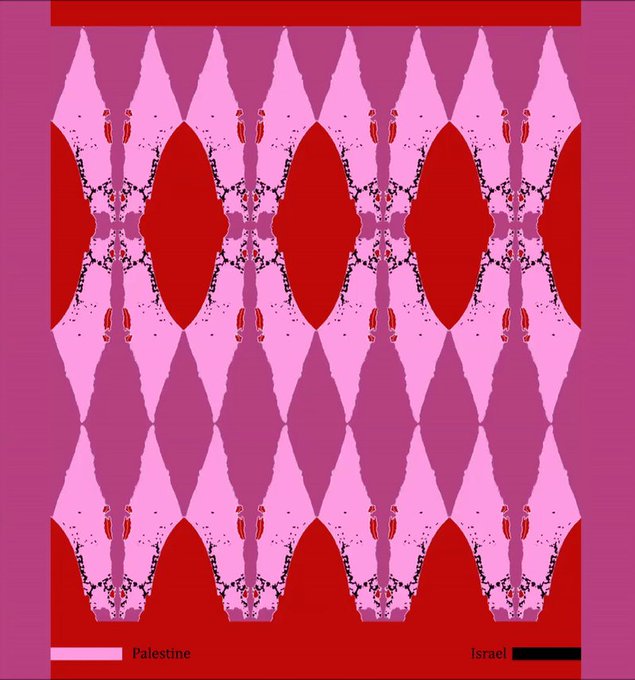
'1946-2012 (fregio)'
collage, animation
2020
maps from: https://t.co/KgRVkNeOQd
#GazaUnderAttack #DataVisualization #Israel #Palestine #occupation #map #gifart #cryptoart


Beautiful infographics and data visualizations in this year's list of @malofiej award winners, including projects by @washingtonpost on The Mueller report, @SCMPNews on Hong Kong protests & @NatGeo on Flights of Imagination https://t.co/AXC4siuiWe


I also love when you see that type of visualization of costumes outside of comics, w/ real world textures, function, form, & a little fashion, turn around & influence costume design IN comics, & characters start to look like they are wearing uniforms that "could" exist. (2/3)


@ravenscimaven Visualization is often a pertinent part of the process. #sciart #biomedicalvisualization #multifaceted


Thought I'd do a little visualization of how Bloo and Cherry first met in my fanfic. Takes place weeks after the "Berry Scary" episode. May make more down the line, but anyone is free to check it out here. All chapters are connected in their descriptions: https://t.co/K1GxVRIyXM


Contrast i and ii 🔥
While combatting with chronic illness over the past week, it’s really got me thinking about the contrast between the body as a liberated temple vs. the body as an agent of destruction. This is my visualization of the battle between self and internal ableism

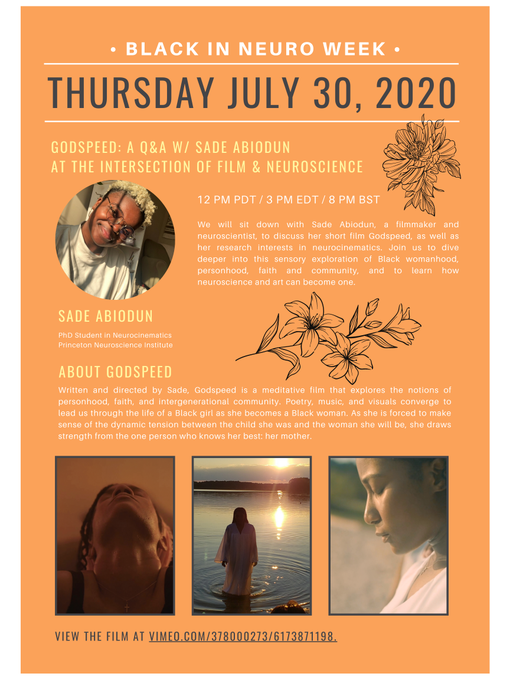
TOMORROW 🗣️ is @BlackInNeuro #BlackNeuroArt day! Post photos of you in the lab, microscopy, data visualizations, your own art, musical & dance performances for an art contest! We also have a live Q&A w/ #BlackInNeuro filmmaker, @sadieonscience 🤩 3PM EDT 🤩


My second commission from Halapmir was a visualization of a dream I had of sorts! Midway in the commission I realized my freedom in art and asked for a blonde mane. Worth!
Art: Halapmir
#furry #furryart #furryscat #scalie #dragonscat


Belkina combines her extensive photography skills, the corresponding advanced digital visualization techniques as well as her knowledge and skills of painting techniques in such a way that she has created a visual language that is entirely her own. #ArteYArt


ISS by Bruce Morser, master of pencil-made (!) cutaways. I had the honor of working with him in many NatGeo projects. From our book Look Inside (Gestalten)
https://t.co/Dw666qzmIH
#illustration #visualization #cutaway #artbook #infographics #informationdesign #visualstorytelling


Brains of the world. One of our graphics in the book The Zoomable Universe, by Caleb Scharf. Published by Scientific American / Farrar, Straus and Giroux #Infographics #dataviz #datavisualization #informationdesign #graphics #graphicdesign #visualization


"We are people talking with people"
Watch @fedfragapane's inspiring talk at DataFest Online ➡️ https://t.co/BOMI9HDDXx
------
Data Visualization Track was supported by @IWPR and Norwegian Ministry of Foreign Affairs.


I recently updated my portfolio, and since it is #PortfolioDay #sciartportfolioweek I decided to share it (again 😬)
I'm a cell biologist/biochemist with a great enthusiasm for science visualization 👩🔬🔬👁️ 🧬🦠https://t.co/LvACj3WnOR #ArtistOnTwitter #sciart

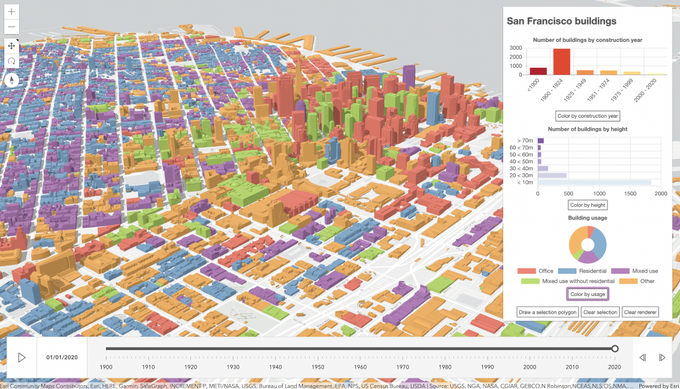
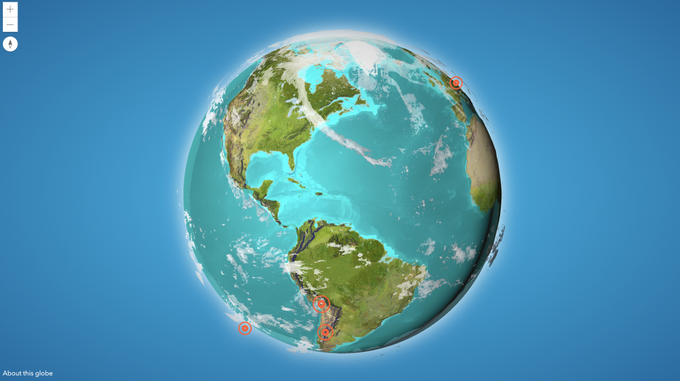

@GISmountains and I will talk about 3D visualization tomorrow at 7:30AM PDT. Join us for a presentation of the main @ArcGISJSAPI features we used to build these apps and a live Q&A where you can ask us all about them 😊
https://t.co/zOEBOYCs0w

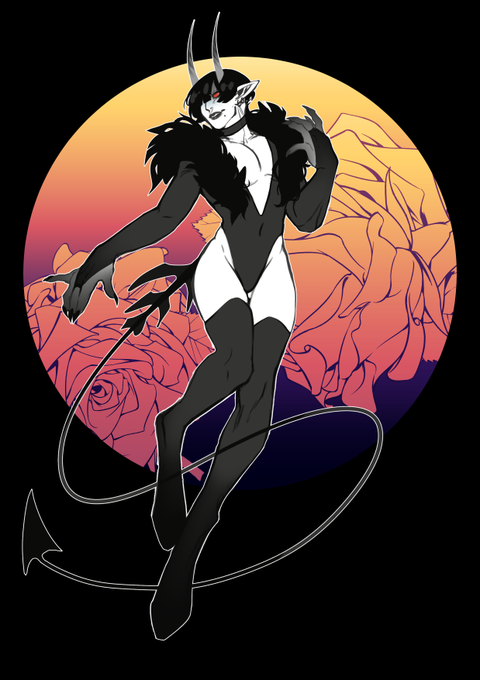
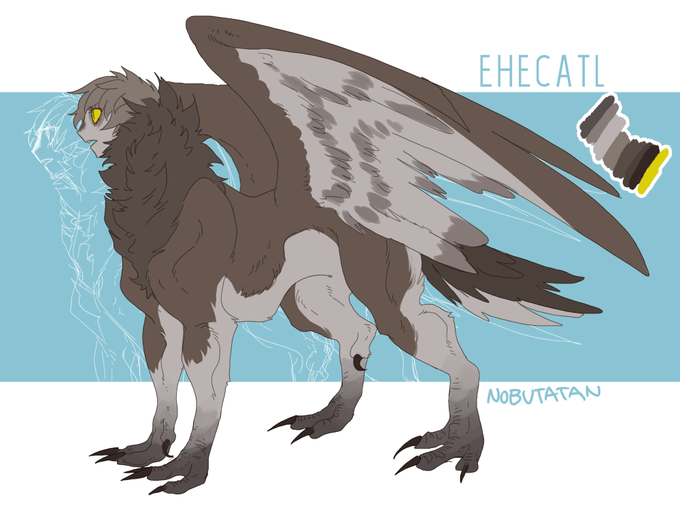
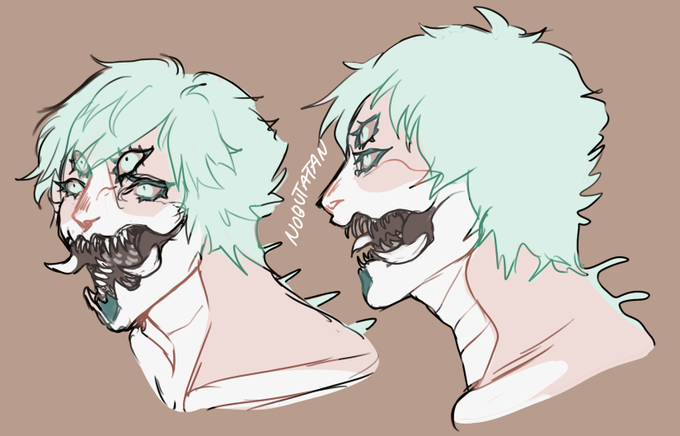
Ok so #OriginalContentArtist is a Tag I can join for sure since OC's are the thing I do--
But hi hello I'm Nobu! I'm 3D animation and visualization student from Finland and I like demons, monsters and other critters


Love this visualization of the sectors, and the idea that every lantern is in their sector on Oa! God I love this book