VisualizationのTwitterイラスト検索結果。 850 件中 31ページ目


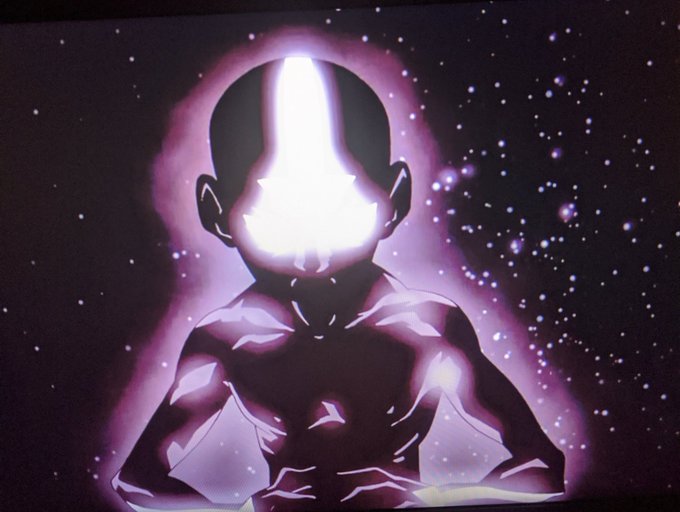

Avatar is such a great teaching show for ALL.😭From representing realistic/CURRENT visualizations of genocide, imperialism, settler colonialism, indoctrination,& patriarchy to healing, redemption, transforming harm,& spirituality.Society can always change, nothing's set in stone.


@solheals It really does help...
though like anything
worthwhile it took
some time to practice.
Visualization of joyful things
and nature is a helpful tool
to aid in relaxing into
meditation.
After 20 years it has evolved
into more than I ever could
have imagined at first!


I've been really dragging my feet when it comes to drawing now that I've got my tablet back up and running, so I decided to try out one of these art memes as a bit of a rapid visualization exercise. No better woman to go out of my comfort zone with. Kinda jank, but whatever.


Okay sophomore year, this was my character visualization class and my final for this was to create a cast of characters and a scene for them. This was an old scrapped scifi comic concept. I just wanted to draw aliens stuff,,,


Noise pollution in 50 cities — my latest #dataviz for @La_Lettura is now online! https://t.co/bsOhVuEdQQ
#Datavisualization #infographic #ddj


Did you know? The soundwave you can see on the cover is actually the visualization of "Go Straight" by @yuzokoshiro , one of the most famous song he composed for Streets of Rage 2.
#SOR4


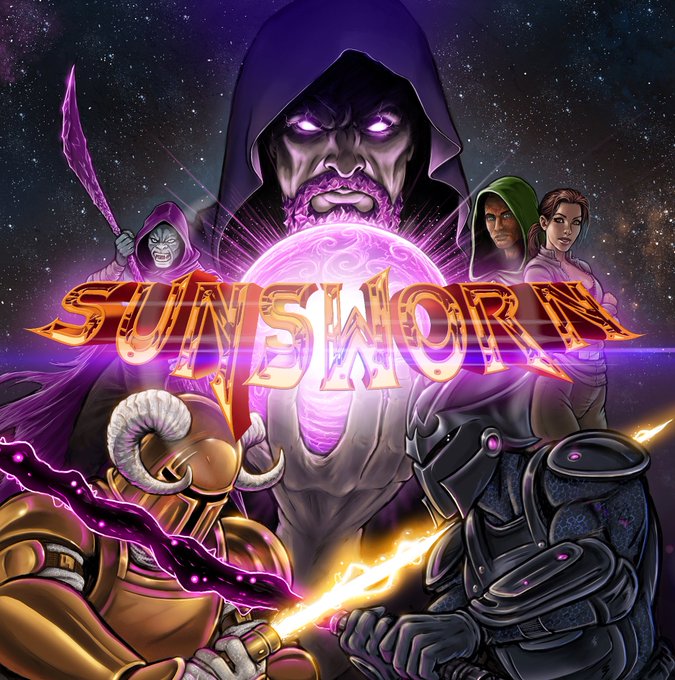

SUNSWORN: EDGE OF ANNIHILATION
Peaceful existence comes to an abrupt end as a forgotten foe emerges to lay claim to the galaxy!
Back this phenomenal novel and partner visualization art book.
Congratulations on the milestone @TheRedGaze
https://t.co/X6A0iruzCH https://t.co/b7RNP8jFeP


Drop-in on @giorgialupi & me today, May 6, 12pm EDT, as we discuss data visualization, activism, compassion, haircuts, and the power of design in @MuseumModernArt’s new Instagram Live series. To prepare, enjoy her and @stefpos’ new post in MoMA Magazine https://t.co/DbNvlAvQWq


this is a bit of a better visualization of how it would look as a mask (still figuring out how to get it printed but there's a few options i think)


For those who are especially interested in examining the 2019-2020 East Asia job market based on time period (as a premodernist, I know I was!), last night I created a special sub-page of visualizations that focuses primarily on time period. 🕐 https://t.co/K3FViGIJ0D


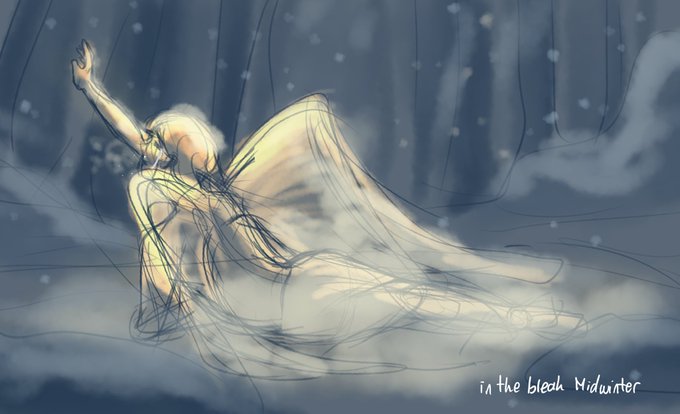
A visualization of @jacobcollier 's in the bleak midwinter
For an art therapy assignment
Honestly this kinda represent my condition rn.. 😂


Here is a visualization of most of the settings on all of the base shields in my shield pack for blender!
What do you think? Are there any other settings you would want to be able to change? Does anyone have any ideas for more shield types?
#b3d #blender3d #material #VFX #scifi


Sketched & painted more concept ideas for Tulip Girl Chuli ##tulip #illustration #Watercolor #characterdesign #conceptart #visualization #watercolour #水彩 #イラスト好きさんと繋がりたい #イラスト


The following data visualization projects by @MesaStudios, Andrew Baker, @HyperfineStudi1, Graham Studios, and @vega_asensio demonstrate how visual material can be used to help communicate a variety of scientific topics. Read More: https://t.co/GR8J2tLsTM #DataVisualization