datavizのTwitterイラスト検索結果。 255 件中 5ページ目


South America - 1922 - John Bartholomew and Son - "The Times" Atlas
#arcgispro #b3d #SouthAmerica #GIS #dataviz


Had you told @DataRevelations 4 years ago that he would advocate building a dashboard by committee he would have said you were crazy. Find out not only what changed his thinking, but also how he learned to make better, faster #dataviz working with others. https://t.co/PHdXXuJwge


New week, new release, new chart, new feature
🥳🥳🥳🥳🥳🥳🥳🥳🥳🥳
We have just released an updated version of RAWGraphs with:
- voronoi diagram, horizon graph and parallel coordinates
- new data samples
- links to the tutorials for all the charts
Enjoy! #dataviz #opensource


My projects for @la_lettura have been nominated for the @europeandesign Awards 2021 and I’m now finalist! Thank you!
#datavisualization #dataviz #infographic #ddj

#FromTheArchives : Spatial Data Archaeologist, @wallacetim, draws inspiration from mapping things that no one has seen before. @colemanrharris presses Tim about his artistic process and the dreaded question of whether he prefers print or digital. https://t.co/BjG8eqD1YH #dataviz


Data analysis.
(Throwback cartoon)
Follow for more cartoons!
#Data #dataviz #DataScience #DataAnalytics #DataScientist #DataMining #whatpeoplelike #comics #comicstrip #webcomic #webcomics #cartoon

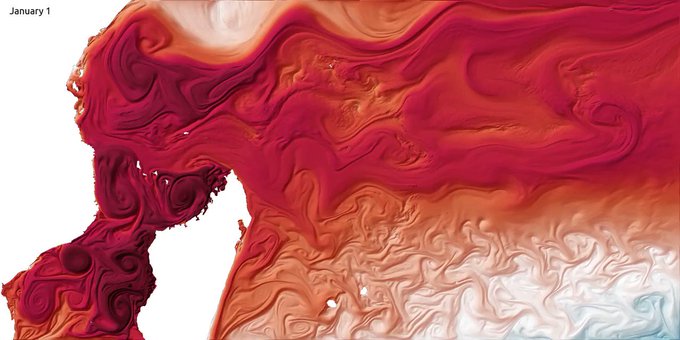
One year of sea surface temperature in the southwestern Indian Ocean. #dataviz
Source: https://t.co/8wQjYqXc6J

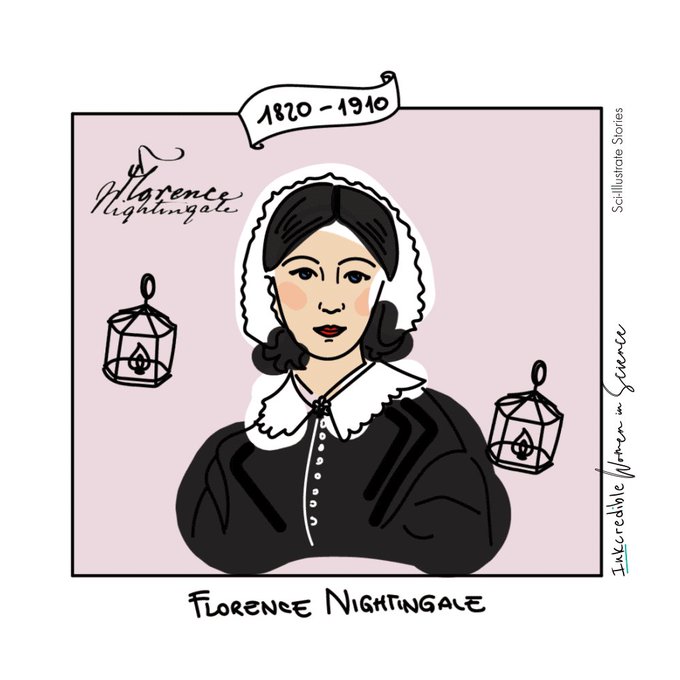
A nurse, social reformer and #dataviz pioneer. Re-discover the story of Florence Nightingale in our new #INKcredibleWIS post.
https://t.co/4ascEZkvFa
Illustration+post @Ele_AdamiAnimation
Set in motion by @RadhikaPatnala
Sci-Illustrate Stories


1/ Since '93 I've been working hands-on (concepts ⇄ IXD/UX ⇄ datamodels ⇄ front/back/devops ⇄ fabrication ⇄ hardware): web, generative design/audio/DSP, dataviz/database/semweb, museum/art/tradeshow/light installations, architecture, branding, games, print, dozens of collabs


On me dit dans l'oreillette que c'est #PortfolioDay
#print #branding #illustration #dataviz #infographies #isométrie #map #carte


Bedrock Geologic Map of Indiana - 1987 - State of Indiana Department of Natural Resources
#arcgispro #b3d #geology #geography #GIS #dataviz


Where do the world's ~1 billion sheep live?
This map was generated with #Python using #Matplotlib, #Numpy and #Pandas.
#Data #DataScience #dataviz #geography #livestockfarming


Had a blast working with @lesliehook and @hjesanderson on this incredible long read on the transition from fossil fuels to clean energy gathering speed, and what it means for the balance of power
Thanks to @VaisalaGroup for the map data
https://t.co/RUuRFGYla0
#gistribe #dataviz

#Dataviz
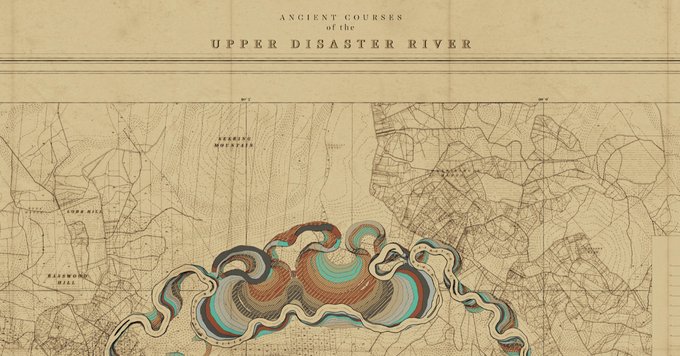
This is beautiful: "Meander is a procedural system for generating historical maps of rivers that never existed" created by
Robert Hodgin (@flight404)
https://t.co/sIzb7e1V3R


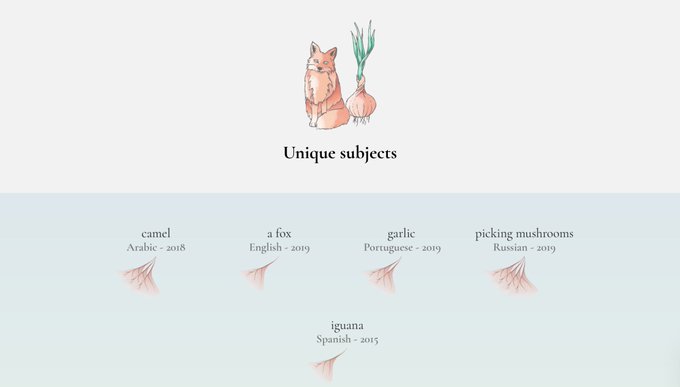
A few illustrations for https://t.co/ViBAvUfMxt my project designed for @GoogleTrends 🐫🐍
Development by @paolo_corti_
#illustration #dataviz


@GroupeLaPoste organised its 5th internal seminar on Data & AI. I had the opportunity to showcase how @jetpackAI uses #dataviz to bring awareness about societal issues: "Dataviz, it is also about love ❤️".
I've also got my caricature done for the first time, courtesy of @rayclid


‘They Think WorkersAre Like Dogs.’ Excellent @pulitzercenter-supported investigation by @USATODAY & @JMitchellNews about Triumph Foods' failure to enact safeguards that could have contained #Covid_19 spread. All credits here: https://t.co/NjhoaxoEpi
#dataviz #illustration


#sindacodiroma (ultimi 250 tweet)
#nodexl #selenium #dataviz #prodomosua: https://t.co/lA3RsNB1Ty


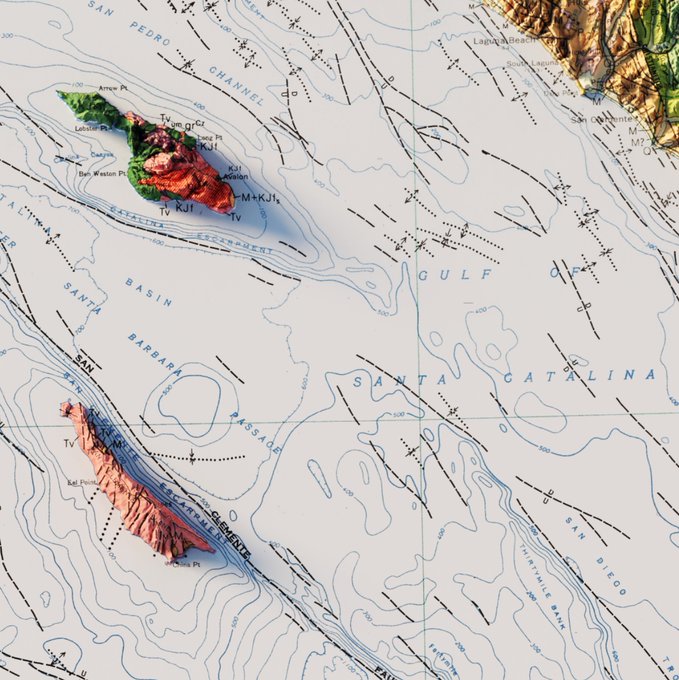

Geologic Map of California - 1977
#arcgispro #b3d #California #geology #geography #gis #dataviz


@JasminDarnell Hi! I draw and digitally model all things #medical #science and #dataviz! All things nerdy I guess.
Thanks for sharing @JasminDarnell